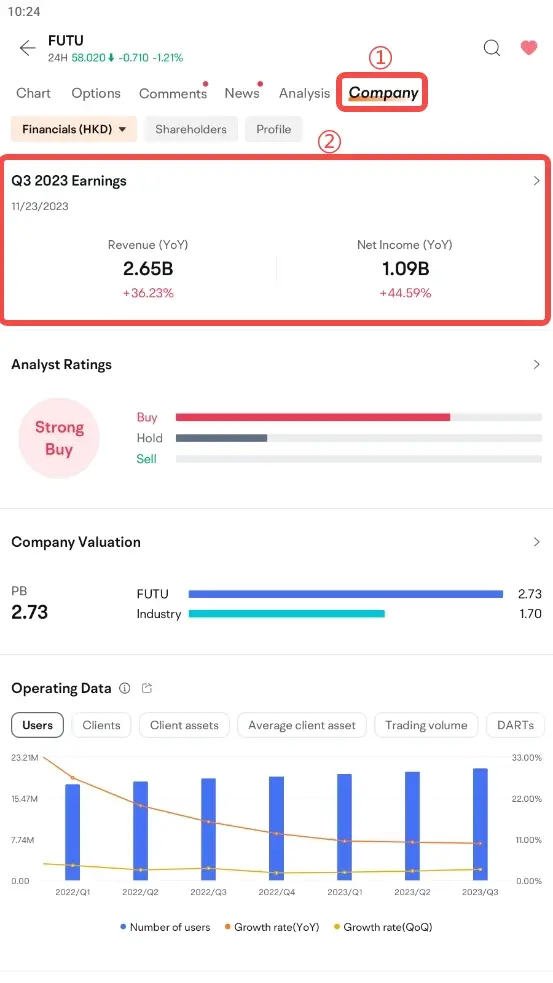
1. Entrance
1.1 Application
stock page - Company - Financials

1.2 Desktop
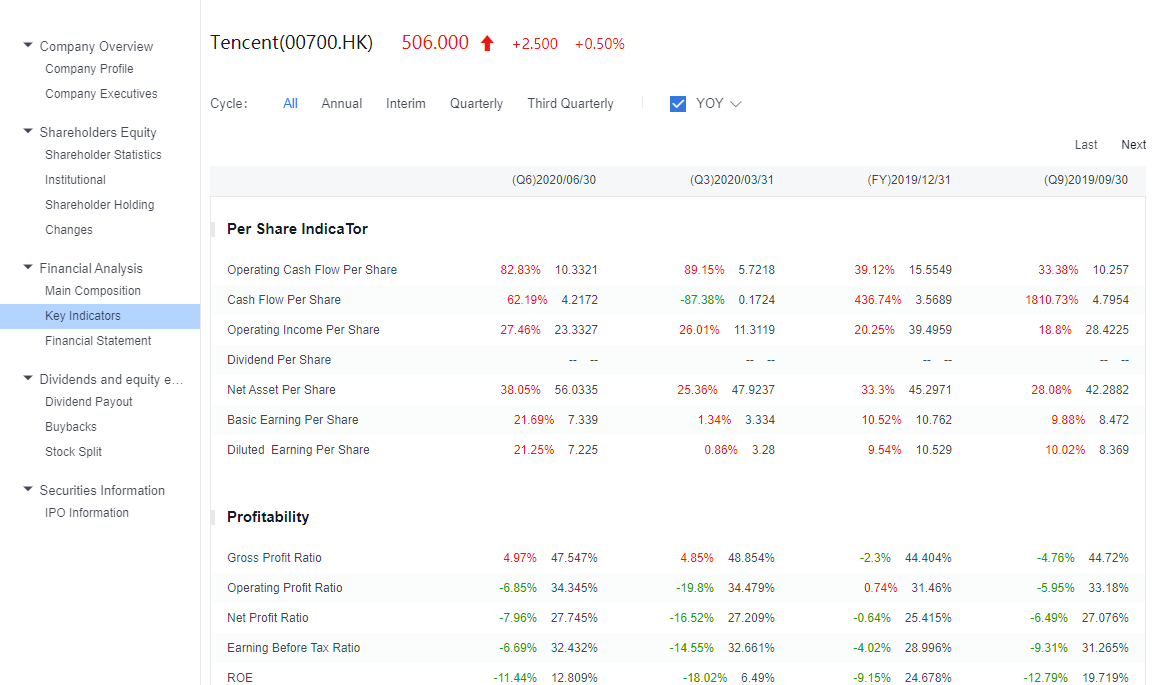
Press F10 on the individual stock page

● Open any stock details page and select the 'Financial Analysis' page to view all financial related data.
● On the desktop, press the [F10] key on the keyboard on any interface, select 'Financial Analysis' on the F10 page, and you can also view the complete financial details.
2. Function entrance
2.1 Revenue Composition
● App
The Futubull app displays the composition of the main business income of the latest financial report by default.

● Desktop

The details page shows the different financial reporting cycles of individual stocks, the main business income, profit, cost, etc., divided according to different dimensions:
1) Switch between three split dimensions: by business, by product, and by region;
2) Switch between three financial reporting cycles: all (annual report + interim report), annual report, and interim report;
3) Switch data of different dates;
4) Show/hide the synchronized data.
2.2 Financial report details
● App
Click 'Detials' on the mobile phone to enter the complete financial report details page. The details page functions are as follows:
1) Switch the three report types;
2) Switch the type of financial reporting period;
3) View historical financial report data;
4) Show/hide year-on-year data.

● Desktop
