FUTU HK Help Center-Heat map
English
Back
Open Account
Clear
All
Quotes
News
Learn
Help
All
HK
US
CN
SG
AU
JP
All
News
Announcements
Reports
No matches yet
Operations too frequent. Please try again later.
Please check network settings and try again Refresh Refresh
Loading
History record
    Latest News
      Quotes More
      News More
      Learn More
      Help More
      Loading
      News More
      Announcements More
      Reports More

      Heat map

      1. Entry

      Market - HK/US - Heat Map


      2. How to Interpret the Heat Map

      2.1 Area of a sector

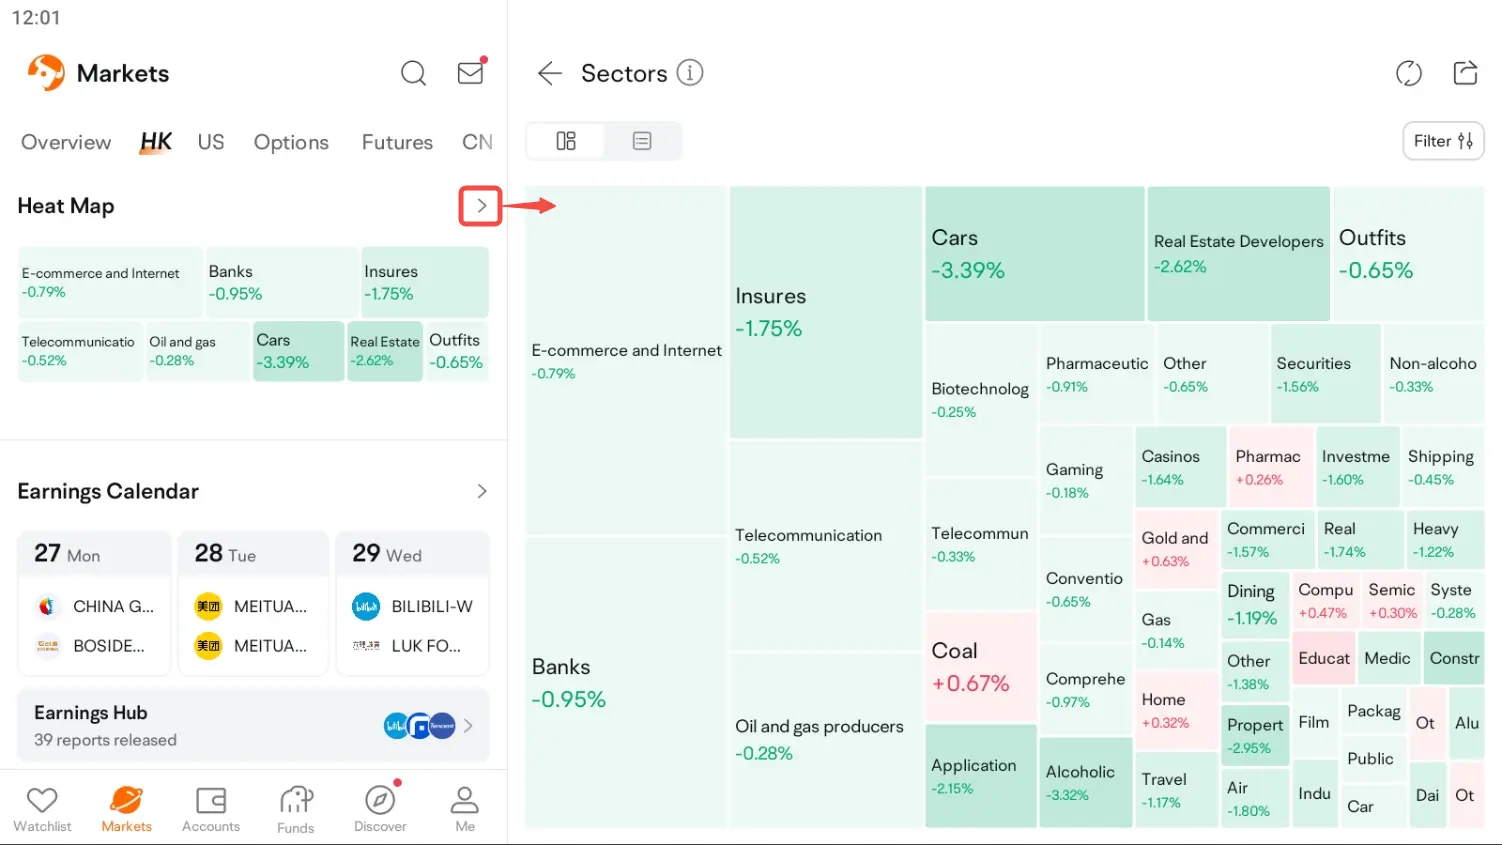
      The heat map can be drawn by Market Cap, Volume, and Turnover. Take the heat map drawn by Market Cap as an example. The larger the total market value of the corresponding stock is, the larger the sector area will be. The sector area is calculated as follows:

      Sector Area = Total Area * Sector Market Cap / Total Market Cap  

      2.2 Color of a sector

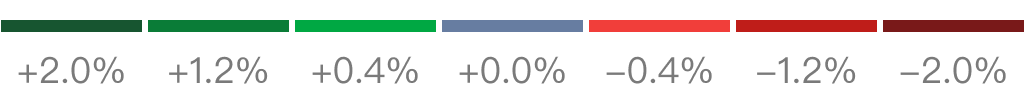
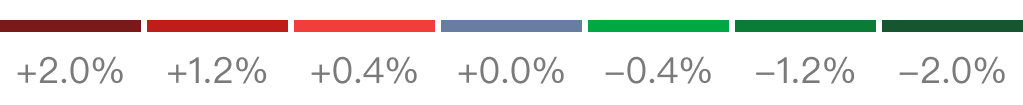
      Square color reflects gains and losses of a sector. The stronger the price moves, the greater the contrast between square color and background color.

      Green Up / Red Down:

      Red Up / Green Down:


      3. Custom Settings

      3.1 Sort

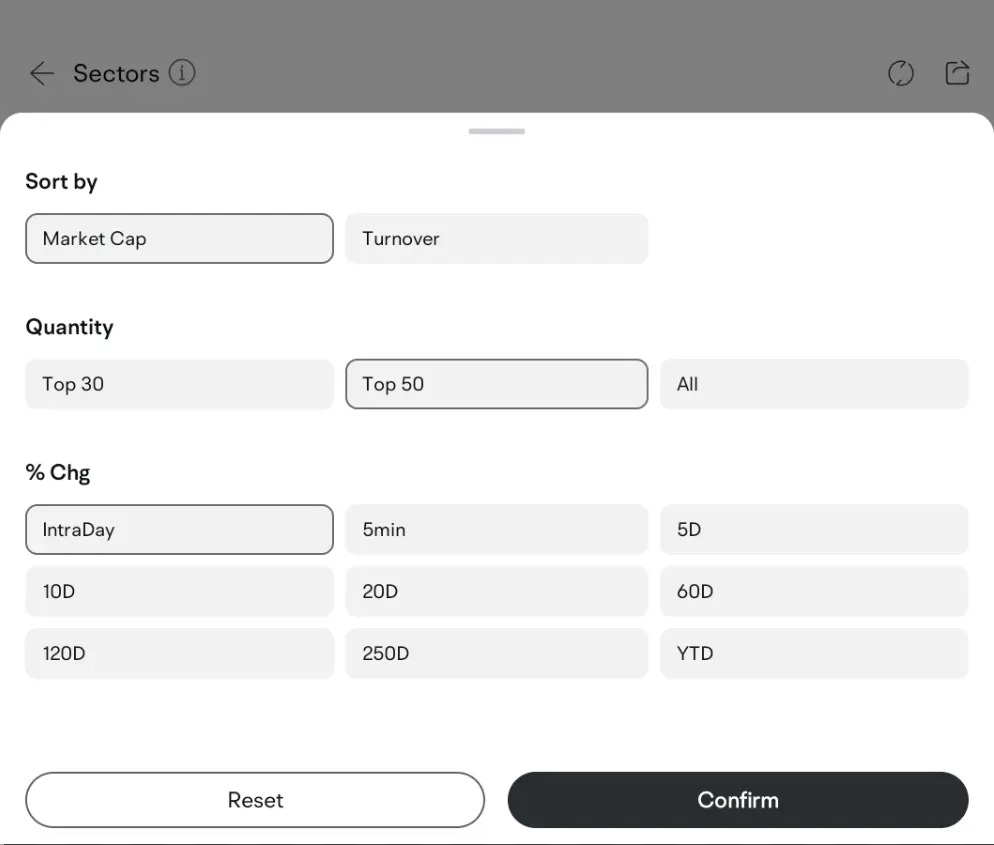
      Sorting will affect the order and area of a sector. You can sort the sectors by Market Cap, Volume, and Turnover.

      3.2 Quantity

      The quantity of sectors will be changed. Top 30, Top 50, and All are available.

      3.3 %Chg

      %Chg will affect the color of a sector. You can view it by intraday, 5m, 5D, 10D, 20D, 60D, 120D, 250D, and Year.


      Discussing
      北水爆買!中國資產能否延續漲勢?
      3月17日早盤,地產代理、物業服務及管理等板塊漲幅明顯,貝殼-W早盤漲逾4%,碧桂園服務漲逾9%。政策消息面上,兩部門發文落實專項債支持收地,中房協組織民營房企座談會。中國資產本輪火爆行情還能持續多久?你會如何投資? Show More
      北水狂掃港股!近期如何操作?
      71%
      29%
      看好!繼續加倉
      我恐高,逢高減倉
      16K votes