XIAOMI-W
01810
BABA-W
09988
MIXUE GROUP
02097
4
BAWANG GROUP
01338
5
TENCENT
00700


Heikin-Ashi charts, a special type of chart derived from normal candlestick charts, filter out some technical noise and can help users better capture the trend.
● New Close = (Original Open + Original High + Original Low + Original Close) / 4
● New Open = (New Previous Open + New Previous Close) / 2
● New High = Max {Original High, New Open, New Close}
● New Low = Min {Original Low, New Open, New Close}
● New Change = New Close - New Previous Close
● New % Change = (New Close - New Previous Close) / New Previous Close
● Compared with normal candlestick charts, Heikin-Ashi charts can filter out some short-term price fluctuation signals and obtain a relatively smooth long-term trend.
● Heikin-Ashi charts usually have more successive bars of the same color, indicating an uptrend or downtrend over a longer time period. When the color reverses, there is a high probability that the trend will reverse.
● During a bullish period, the opening price of a Heikin-Ashi chart is often equal to the lowest price, and there is no lower shadow; during a bearish period, the opening price of the Heikin-Ashi chart is often equal to the highest price, and there is no upper shadow.

(Normal candlestick)

(Heikin-Ashi)
● Since the open, high, low, and close of a Heikin-Ashi chart are calculated based on the data of the original candlestick chart and the previous data of the Heikin-Ashi chart itself, there will be inconsistencies between the data of the Heikin-Ashi chart and that of the normal candlestick chart.
● The data of the original indicators is calculated with the open, high, low, and close of the normal candlestick chart and can still be used to reflect the signal of the original candlestick chart.
● After switching to the Heikin-Ashi chart, the original reminder line and cost line will not be affected.
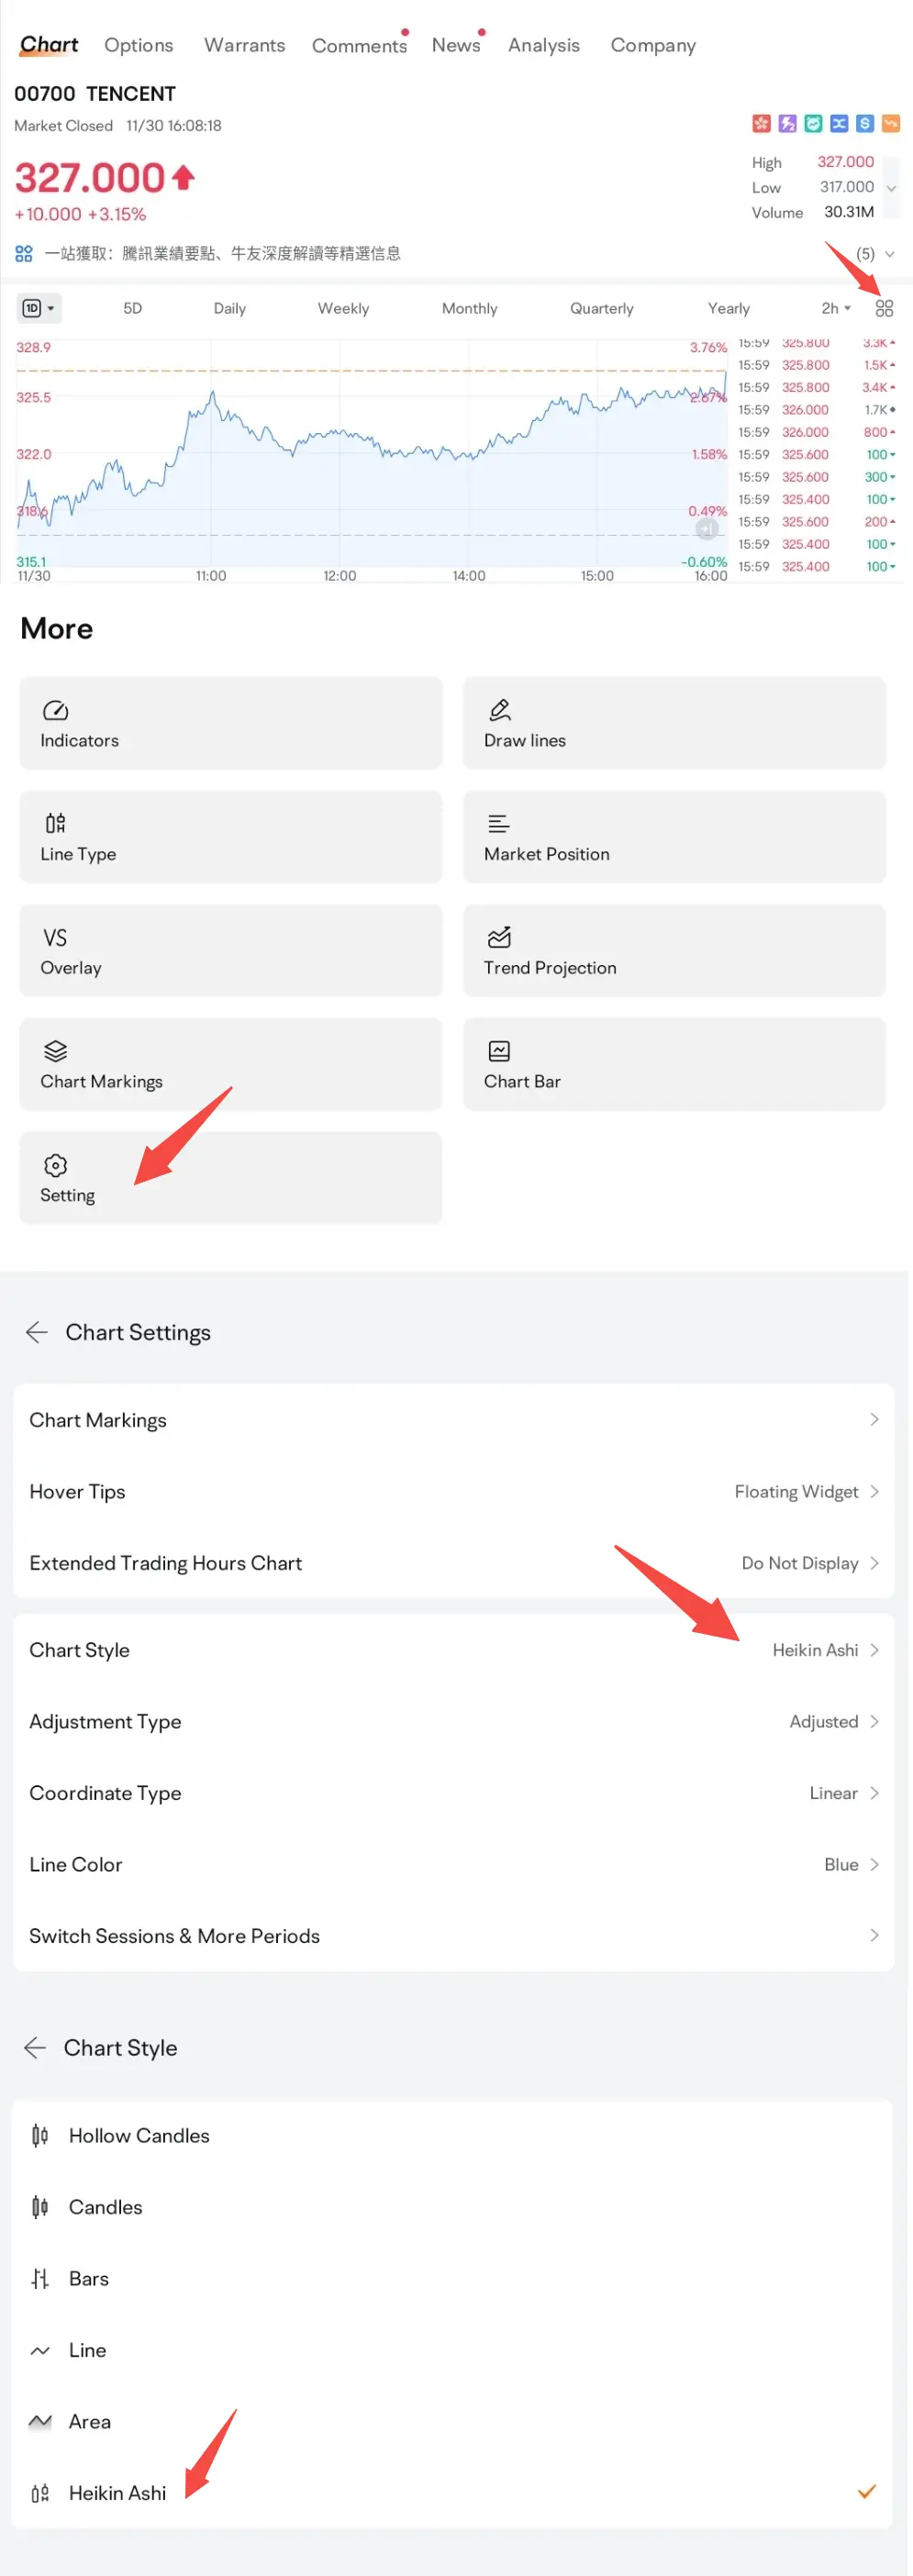
Detailed Quotes - More - Setting - Chart Style