XIAOMI-W
01810
BABA-W
09988
TENCENT
00700
4
MIXUE GROUP
02097
5
CHIFENG GOLD
06693


Also known as the market position overview of float (shares that are available for trading by the public), the Function presents the number of shares held at different prices by investors.
a) Colors (As per the 「Quote Color」 setting in the App. Here "Green Up / Red Down" is used as an example)
Green: profitable positions; position cost < current stock price
Red: loss-making positions; position cost > current stock price
Gray: neutral positions; position cost = current stock price
Blue: current stock price
b) Terminology
Profit Ratio: the proportion of profitable positions
Average Cost: the average price of all positions
Resistance: the average price of loss-making positions
Support: the average price of profitable positions
90% Position Cost Range: the price range of 90% of all positions
70% Position Cost Range: the price range of 70% of all positions
Degree of Overlap: the extent to which the two Ranges overlap. The greater the Degree of Overlap, the more concentrated the positions and the more moderate the stock price fluctuation.
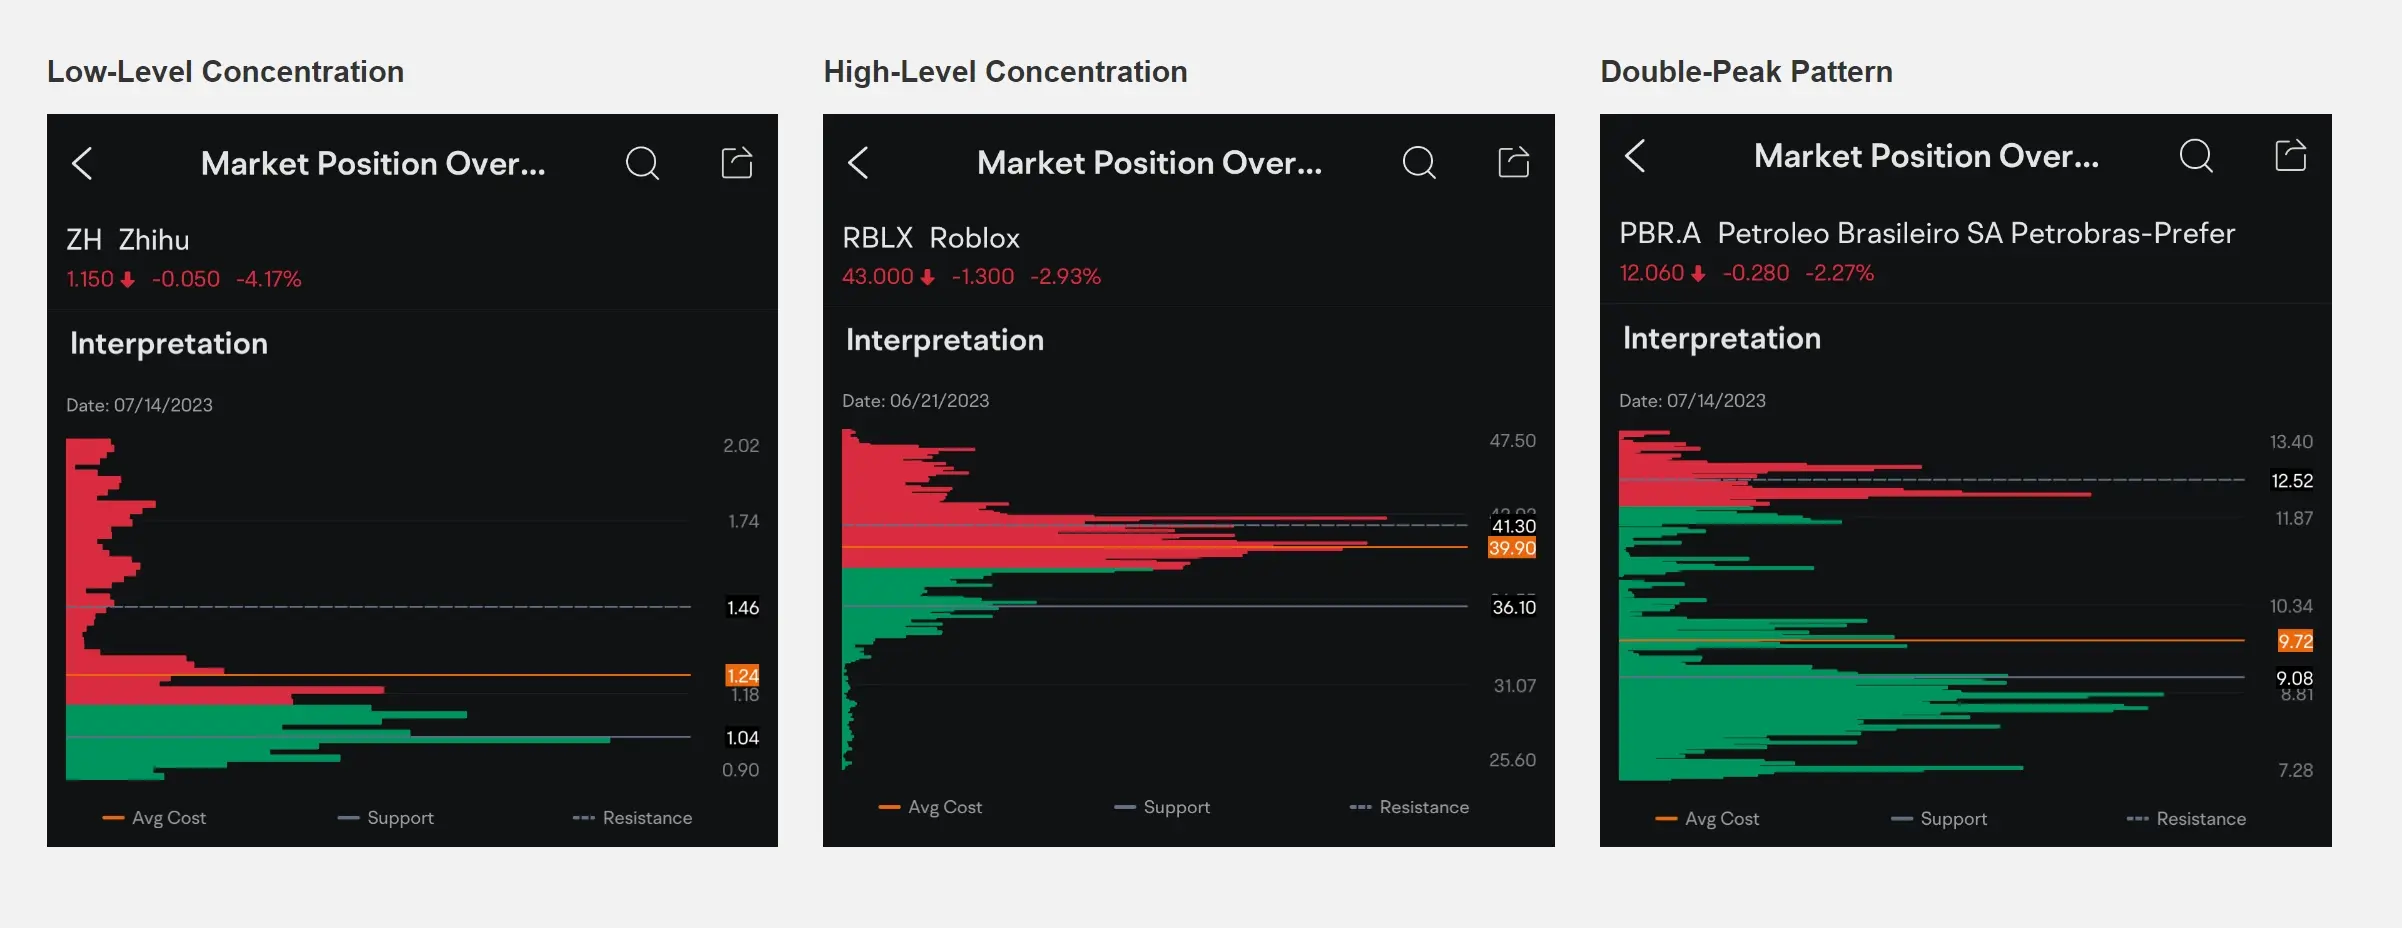
a) Low-Level Concentration: As the stock price falls, position costs gradually decrease. When most of the positions are concentrated to the low price level, the resistance weakens and a rise in stock price is possible.
b) High-Level Concentration: As the stock price rises, position costs gradually increase. When most of the positions are concentrated to the high price level, it may indicate that the low-cost positions have already exited after taking profit and that a momentum to fall is gathering strength.
c) Double-Peak Pattern: This pattern mostly occurs in stocks with repeated price fluctuations within a certain range. The upper peak can be regarded as the resistance and the lower support. Investors may be better off if they 「sell high and buy low」 in accordance with the rhythm of price fluctuations.
Note: All the data and information above are for reference only and do not constitute any investment advice.