
XIAOMI-W
01810
POP MART
09992
BABA-W
09988
4
MEITUAN-W
03690
5
TENCENT
00700


| Symbol | Description |
| <space> | Regular Trade |
| B | Bunched Trade |
| C | Cash Trade |
| F | Intermarket Sweep |
| G | Bunched Sold Trade |
| H | Price Variation Trade |
| I | Odd Lot Trade |
| K | Rule 127 (NYSE only) or Rule 155 (NYSE MKT only) |
| L | Sold Last |
| M | Market Center Close Price |
| N | Next Day |
| O | Market Center Opening Trade |
| P | Prior Reference Price |
| Q | Market Center Open Price |
| R | Seller |
| T | Form T (Pre-Open and Post-Close Market Trade) |
| U | Extended Trading Hours/Sold Out of Sequence |
| V | Contingent Trade |
| W | Average Price Trade |
| Z | Sold (Out of Sequence) |
| 0 | Odd Lot Cross Trade |
| 4 | Derivatively Priced |
| 5 | Re-Opening Price |
| 6 | Closing Price |
| 7 | Qualified Contingent Trade |
| 9 | Consolidated Late Price Per Listing Packet |
| Type | Description |
| <space> | Automatch Trade |
| P | Late Trade (Off-Exchange Previous Day) |
| M | Non-Direct Off-Exchange Trade |
| Y | Automatch Internalized |
| X | Direct Off-Exchange Trade |
| D | Odd-Lot Trade |
| U | Auction Trade |
| * | Overseas Trade |
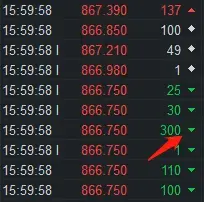
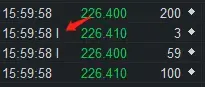
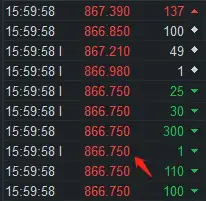
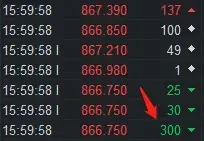
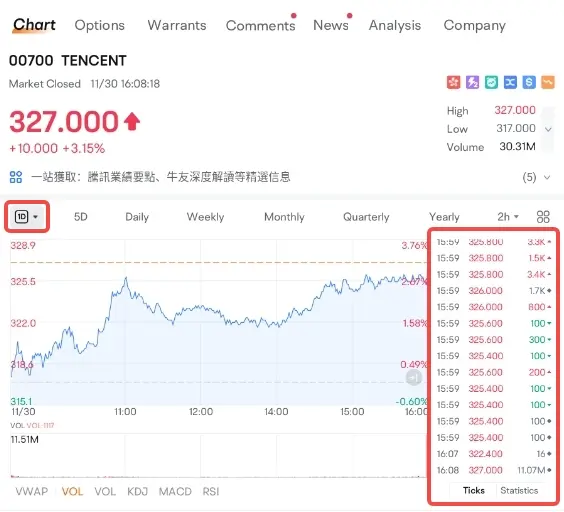
↑: Lift the Offer, meaning the trade is executed at the offer (or ask) price; shown in "Up Color."
↓: Hit the Bid, meaning the trade is executed at the bid price; shown in "Down Color."
◆: Neutral Trade, meaning the trade is executed between the bid and ask prices; shown in gray.
* Users can customize "Up/Down Colors" in Settings. Two types are now available: (1) Red Up/Green Down & (2) Green Down/Red Up.
The color of Trade Price is based on Previous Close price: If it's higher than Previous Close, it's shown in "Up Color"; if it's lower than Previous Close, it's shown in "Down Color"
* Users can customize "Up/Down Colors" in Settings. Two types are now available: (1) Red Up/Green Down & (2) Green Down/Red Up.
The color of Trade Size is the same as Trade Direction color.
Detailed Quotes > Chart > Ticks
Tap the data to enter the details page.
The Trade Statistics feature integrates the data of all the stock's trades on the trading day and presents the integrated data in various dimensions.
Traders may better seize trading opportunities by analyzing Trade Direction and Price by Volume Table.
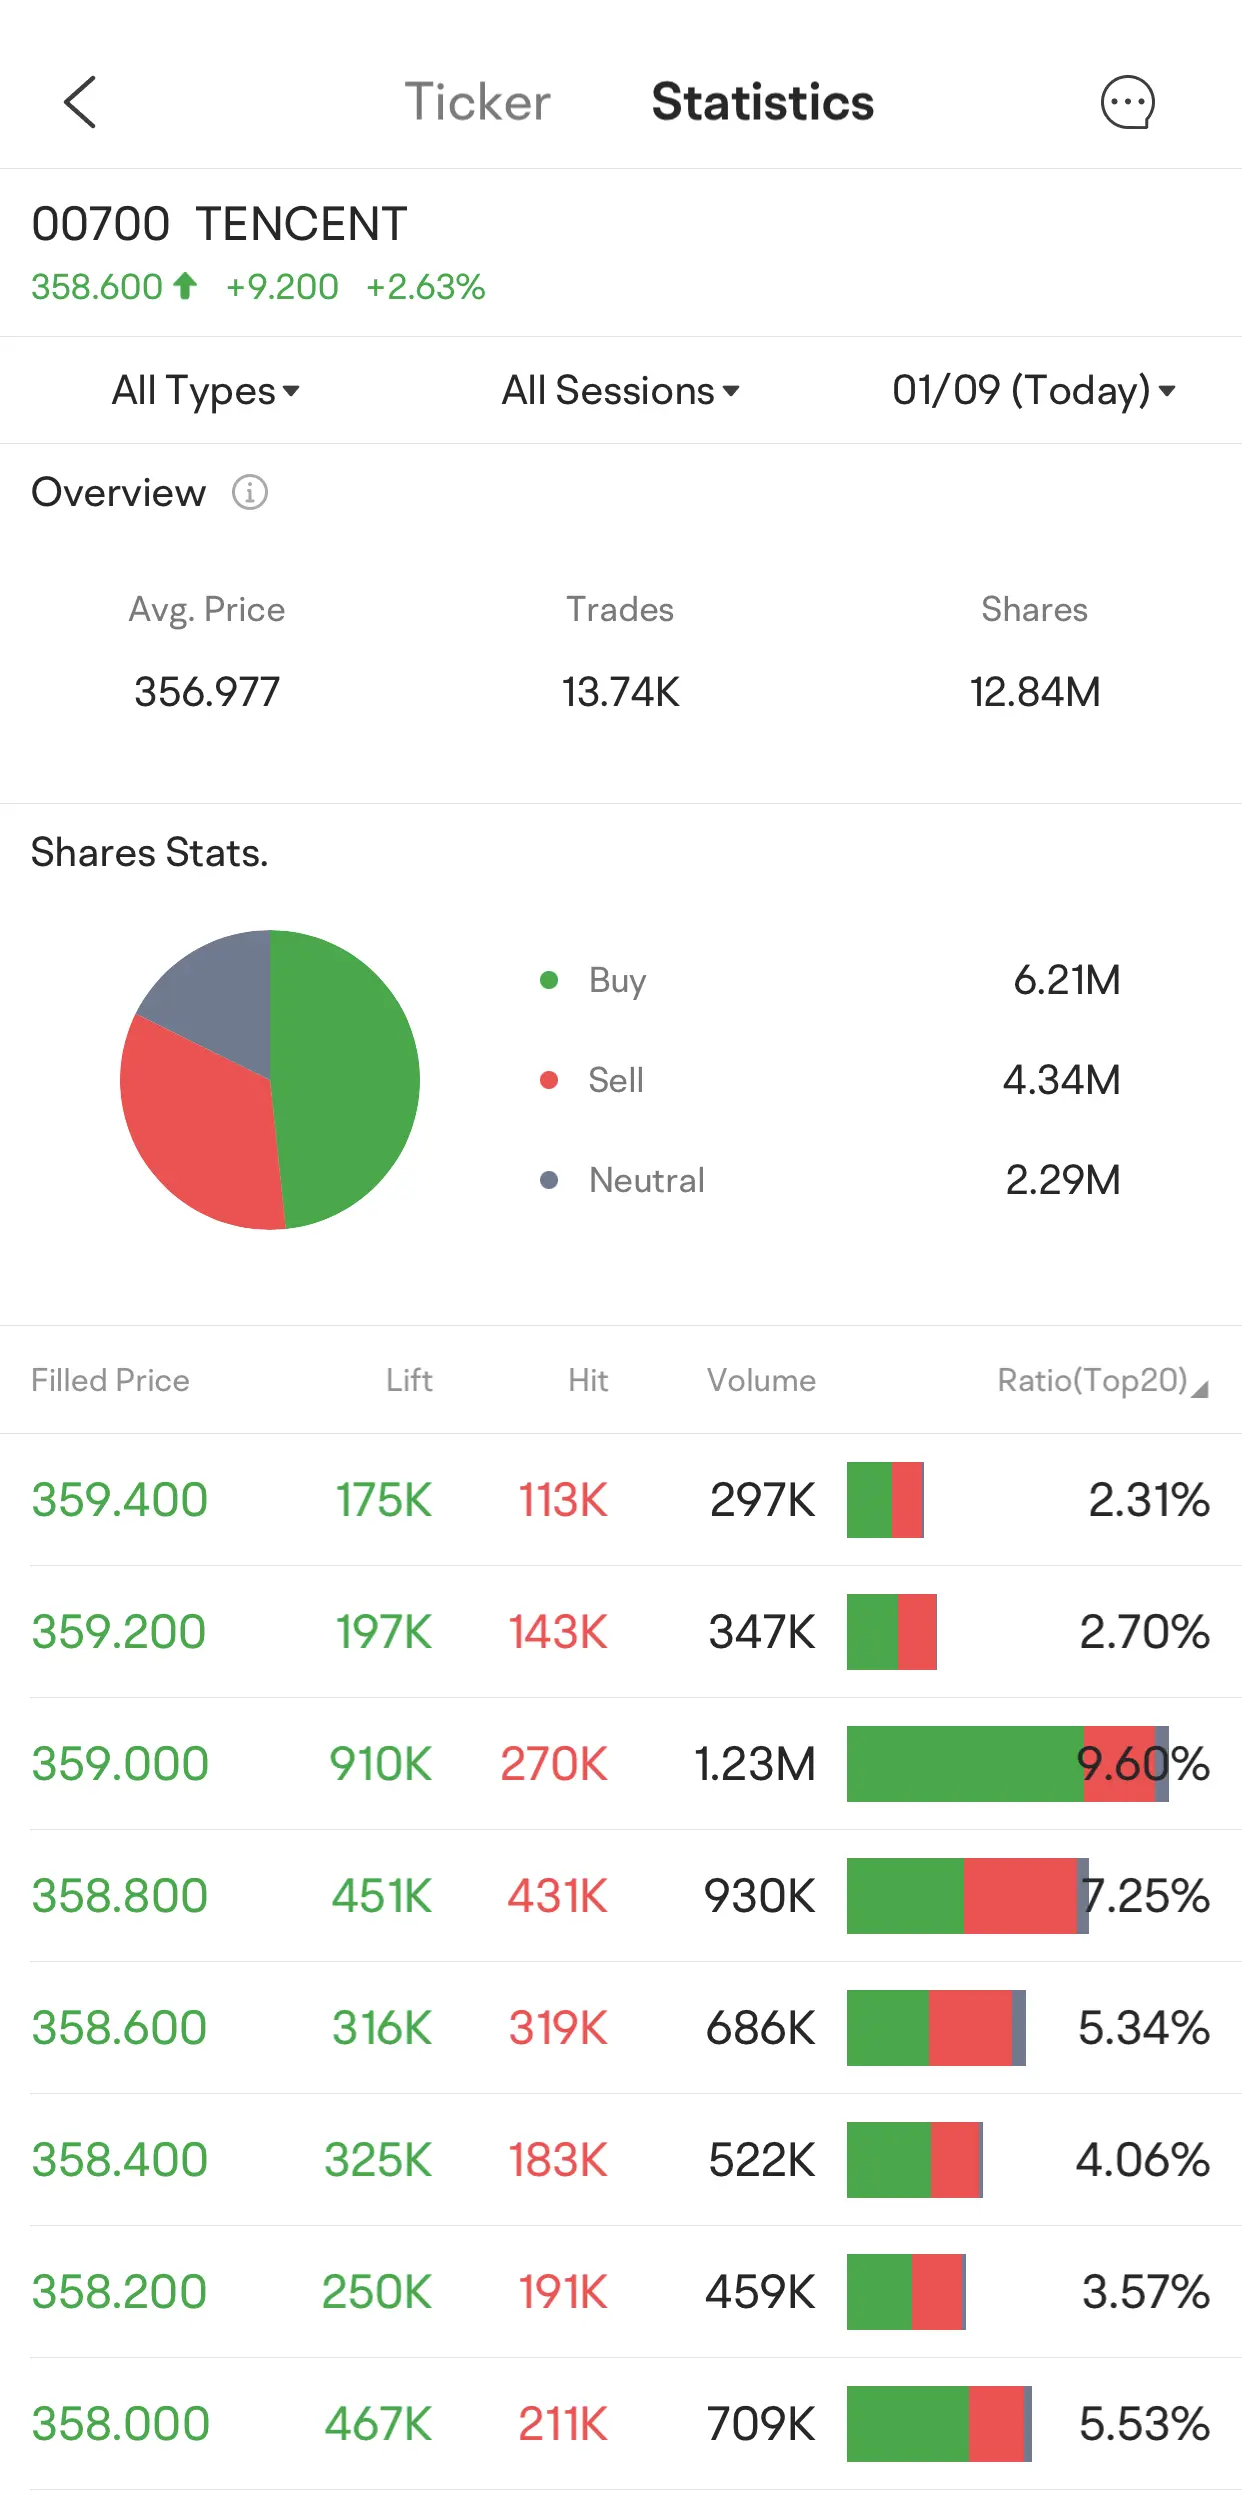
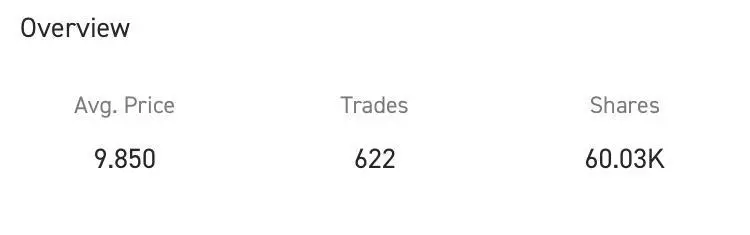
2.3.1 Average Price
The average trade price of the stock on the trading day.
Calculation: Average Price = Total Turnover / Total Volume
The total number of trades of the stock on the trading day.
The total number of shares traded on the trading day.
Trades are classified into 3 types: Lift the Offer, Hit the Bid, and Neutral Trade. The number of shares traded for each type is presented.
The volume, turnover, and weight of different trade prices are presented in the Table.
1. How is a trade classified?
↑: Lift the Offer, meaning the trade is executed at the offer (or ask) price; shown in "Up Color."
↓: Hit the Bid, meaning the trade is executed at the bid price; shown in "Down Color."
◆: Neutral Trade, meaning the trade is executed between the bid and ask prices; shown in gray.
* Users can customize "Up/Down Colors" in Settings. Two types are now available: (1) Red Up/Green Down & (2) Green Down/Red Up.
2. How do neutral trades happen?
1) The trade is executed so fast that it is not disclosed on the order book.
For example, the current bid is $10 and the ask is $12. If two trading counterparties both place an order at $11 at the same time, we will see an $11 trade updated in "Ticks" while the BBO doesn't change. The trade will be defined as "neutral".
2) The trade is executed in a dark pool or other ATS (US Market)
3) Odd-lot trade (US Market)
In the US, there are over 10 exchanges and many OTC dealers. The National Best Bid and Offer (NBBO) presents quote data that shows the highest bid price and the lowest ask price from all available exchanges and trading venues. The NBBO, therefore, represents the smallest spread available.
The direction of a trade is determined based on the NBBO Time & Sales (Ticks) data.
Regulation NMS issued by the Securities and Exchange Commission (SEC) requires brokers to ensure the best execution price available for a stock, and provide the NBBO quote data to their customers during trading. NBBO quote data only displays orders whose size is larger than 100 shares.

