
XIAOMI-W
01810
BABA-W
09988
POP MART
09992
4
MEITUAN-W
03690
5
TENCENT
00700


In the 1D chart of the stock quote page, you can call out the cross line and click tok line to view the time of day. Then, you can view the historical trend for that day.
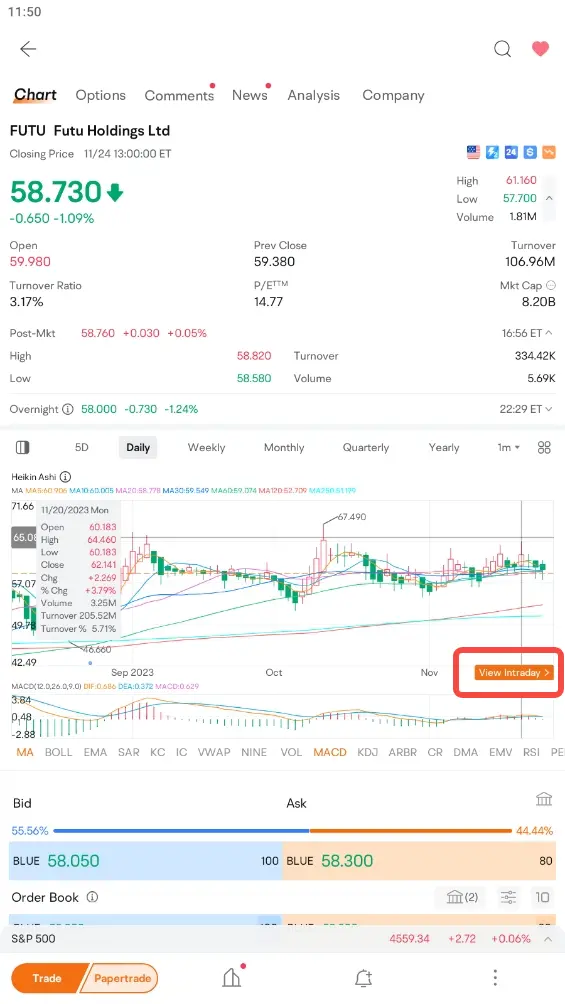
In the 1D chart of the stock quote page, you can double-click the k line to view the historical trend for that day.


 This strategy is often seen in tariff policies and trade negotiations.
 First, he scared everyone quite a bit, and then he gave a little reward.Imagine you are bargaining in a vegetable market, and Trump's approach is to first raise a loudspeaker and shout: "This pile of cabbage must be sold to me for 100 yuan today!" When the vendor is stunned, he suddenly rubs his hands and says: "But seeing that you are not having an easy time, let's settle for 80 yuan~"

