MEITUAN-W
03690
XIAOMI-W
01810
JD-SW
09618
4
POP MART
09992
5
BABA-W
09988


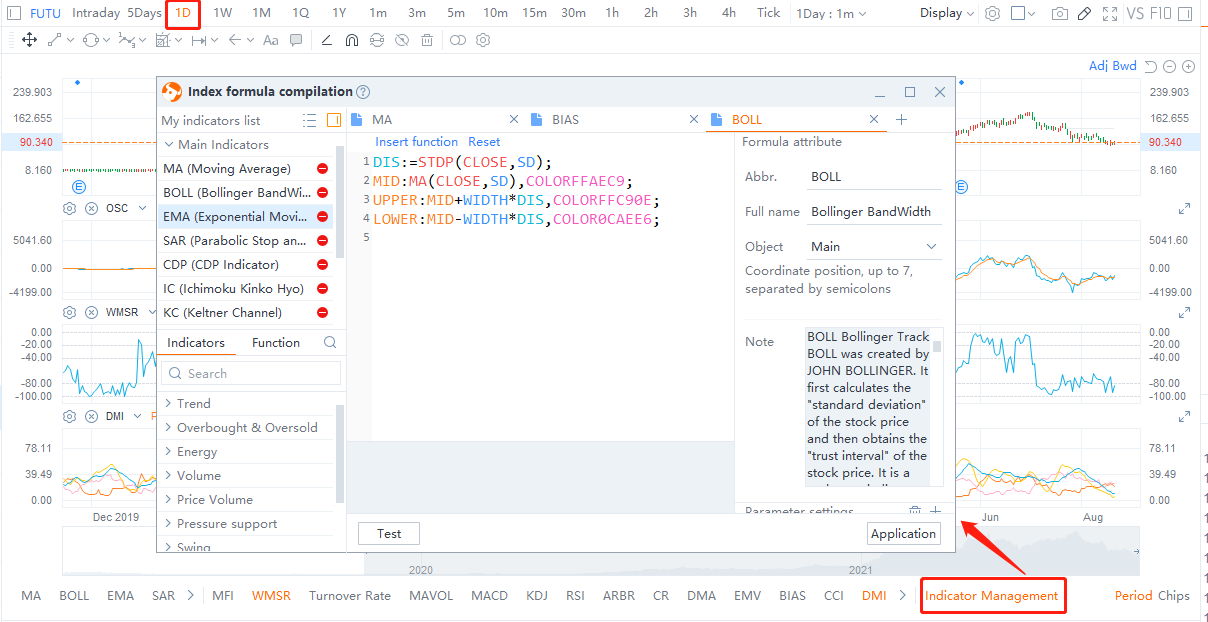
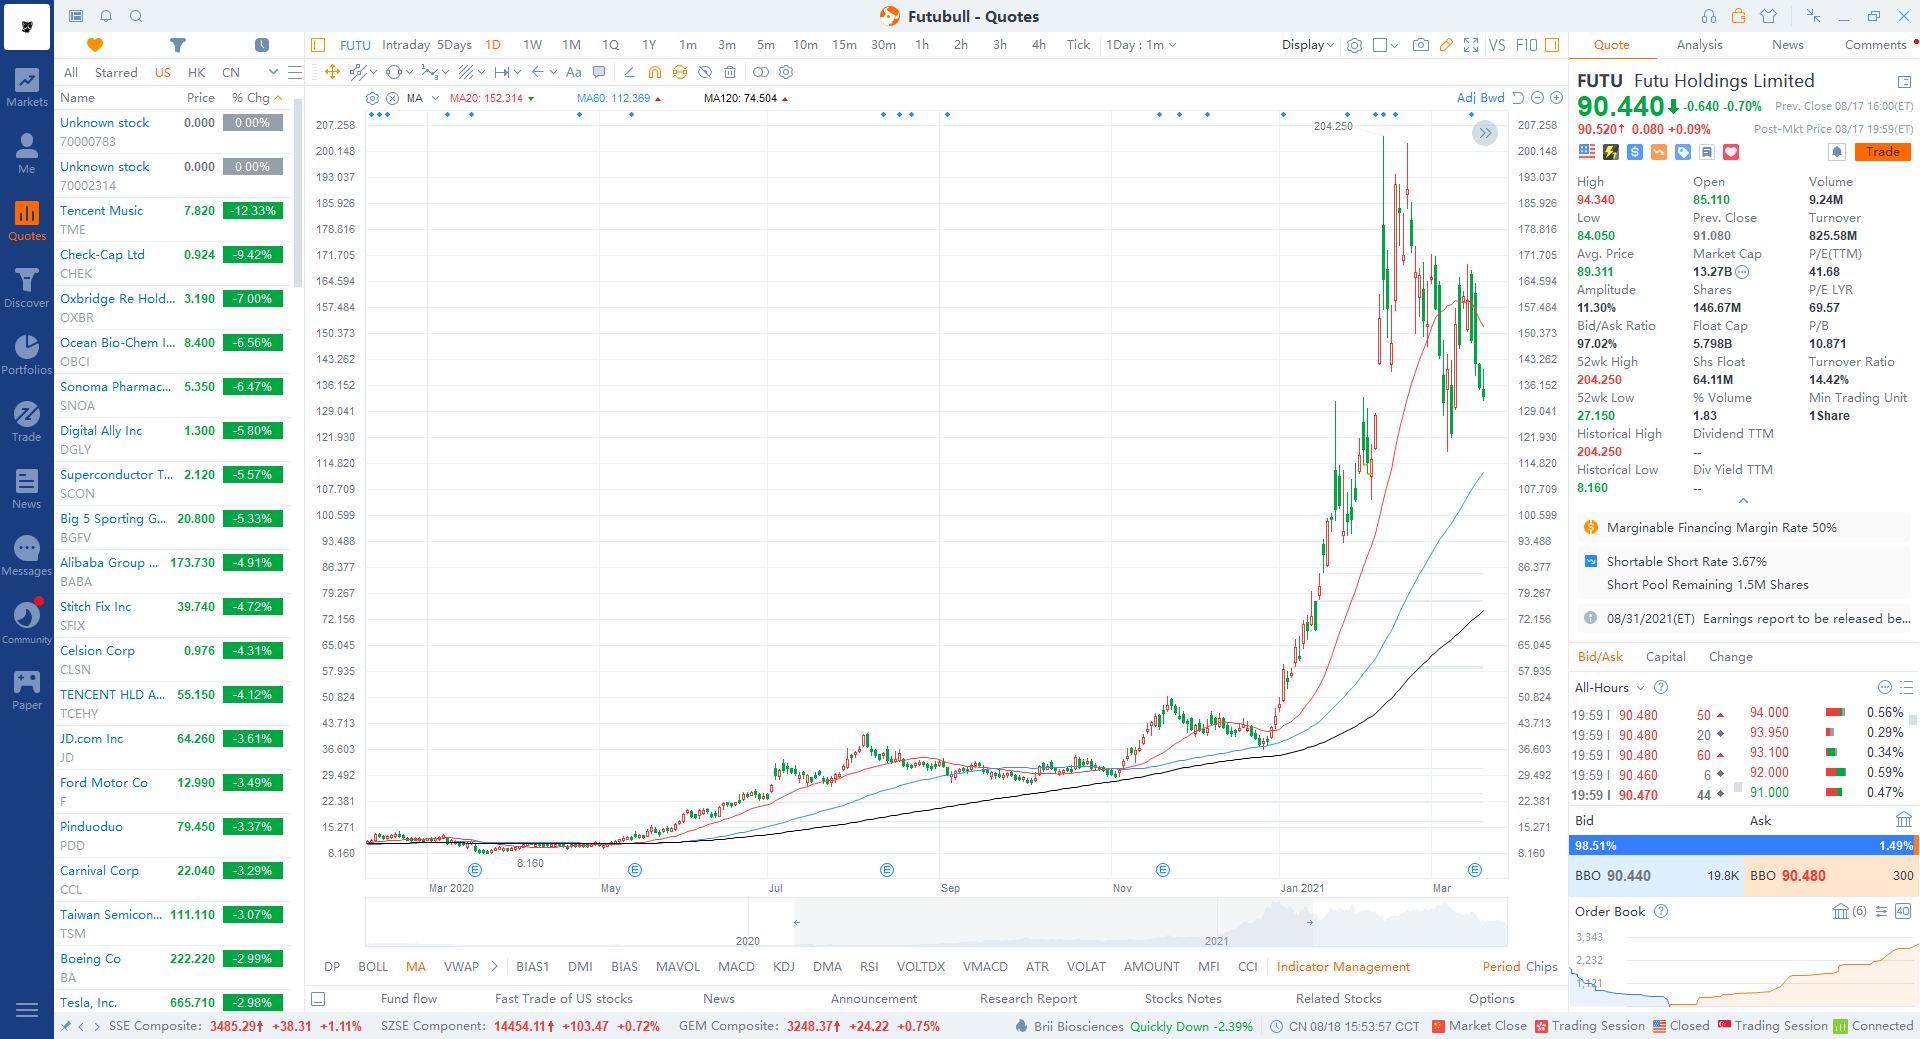
Click "Quotes" tab --> Click "1D K-Chart" --> Click "Indicator Management"
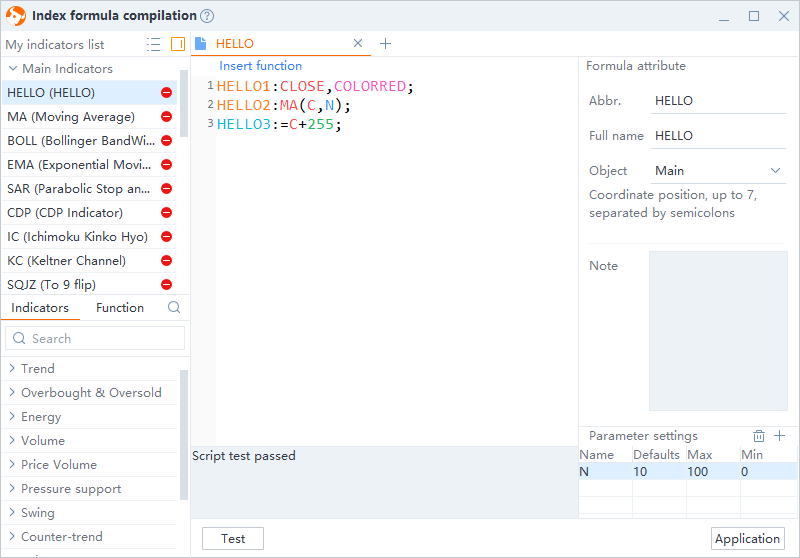
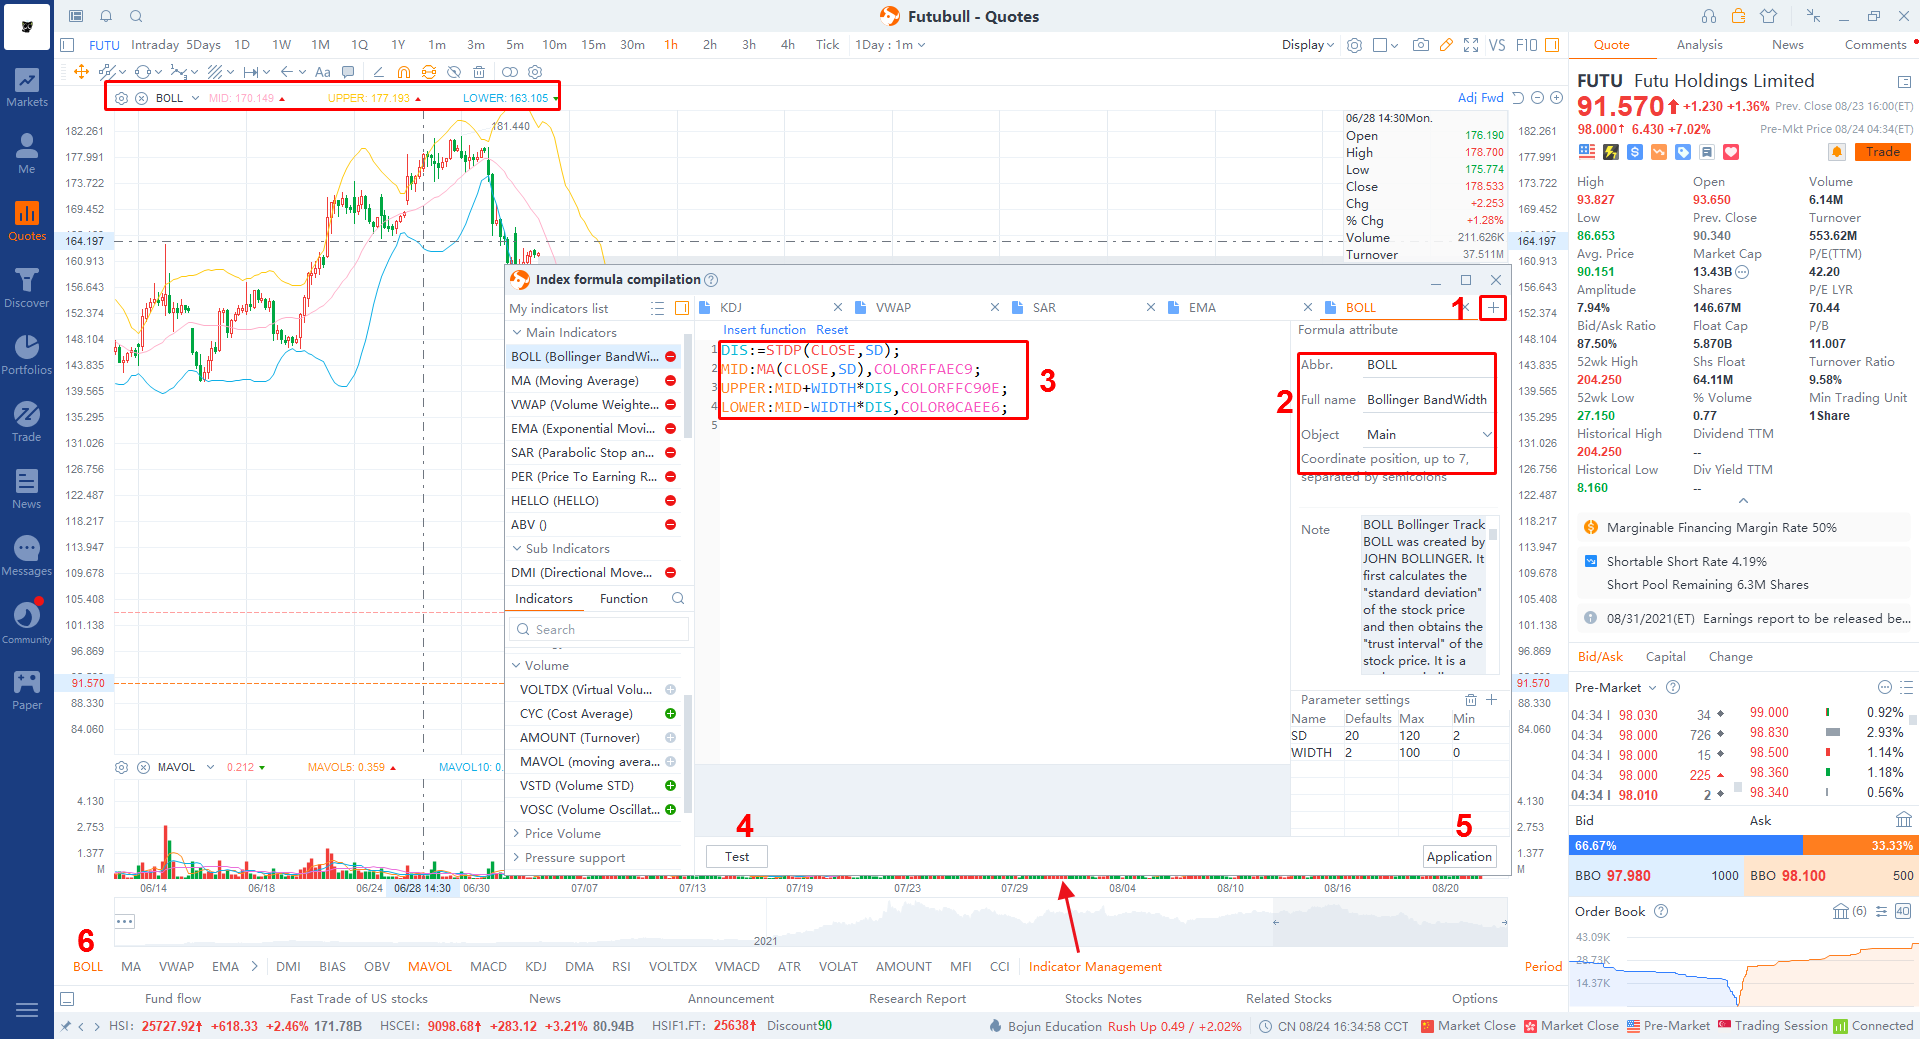
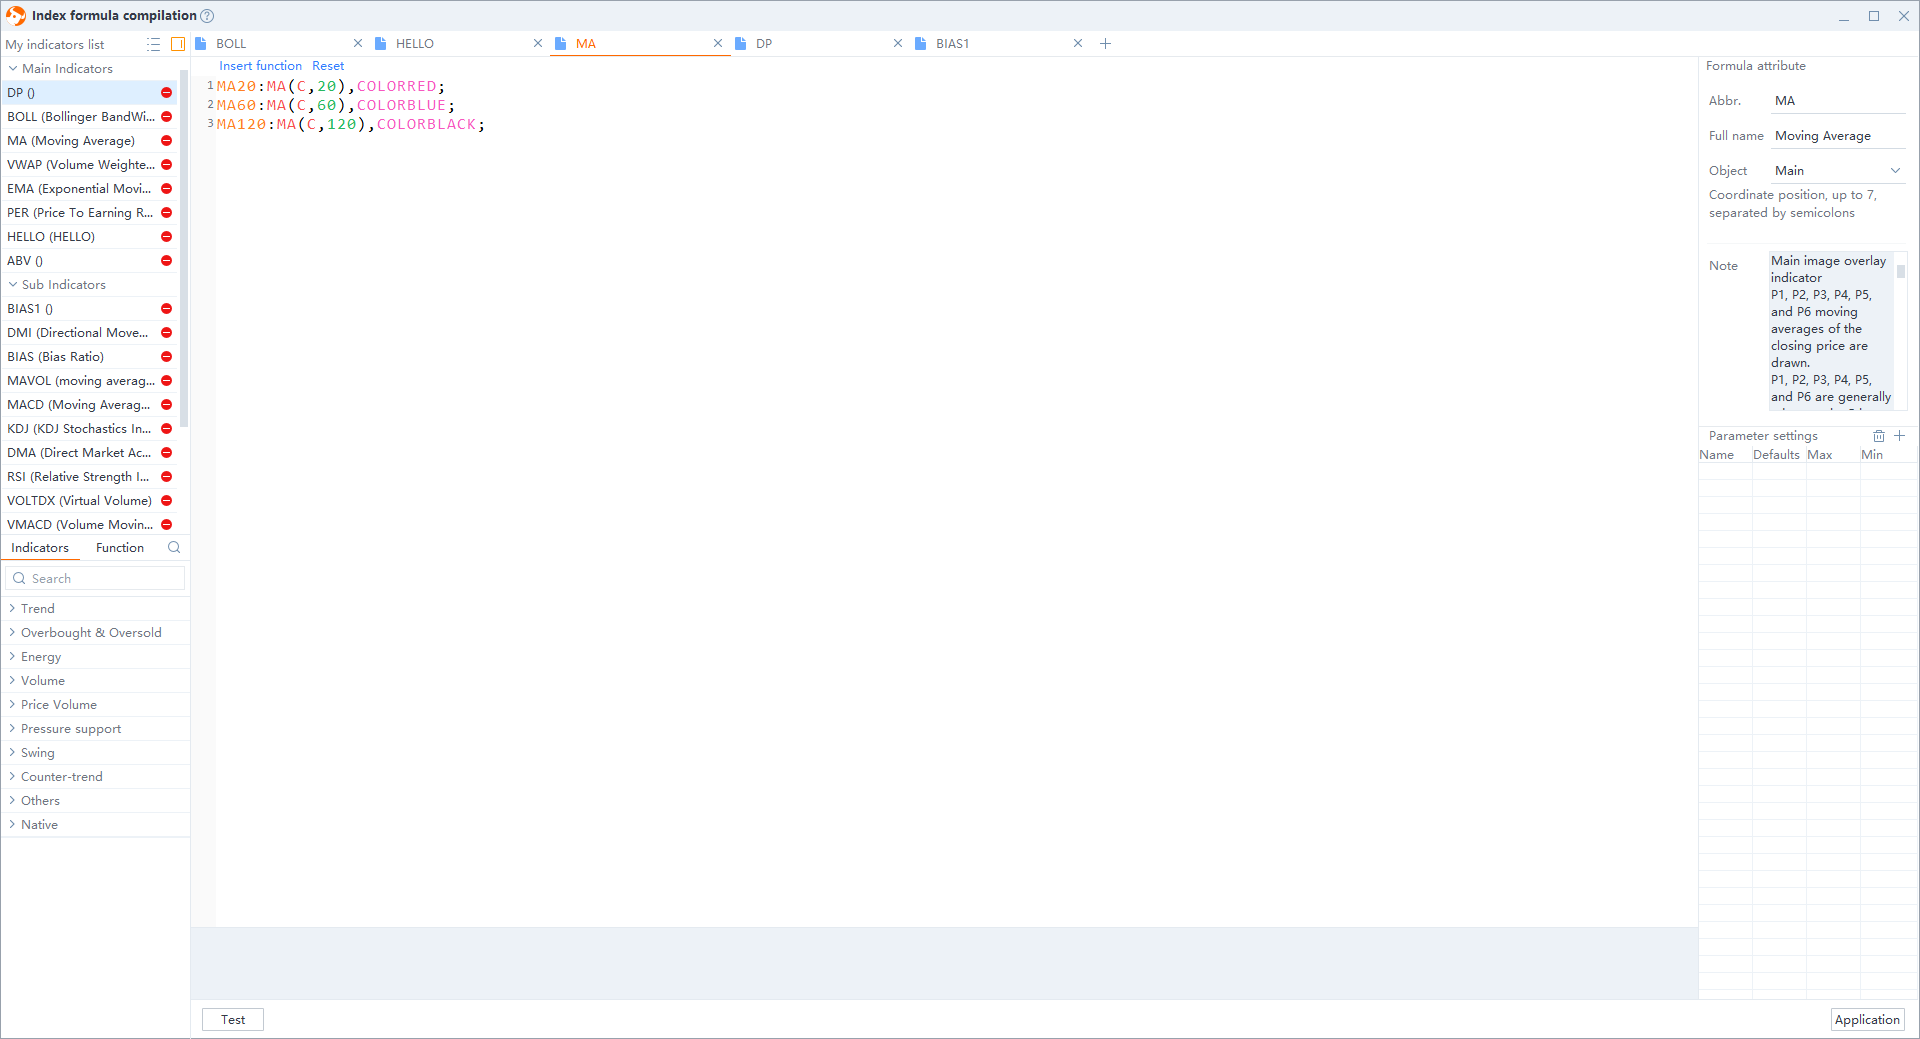
Functions: My Indicators list, Indicators, Function, Code compiling area, Formula attribute, Note, and Parameter settings
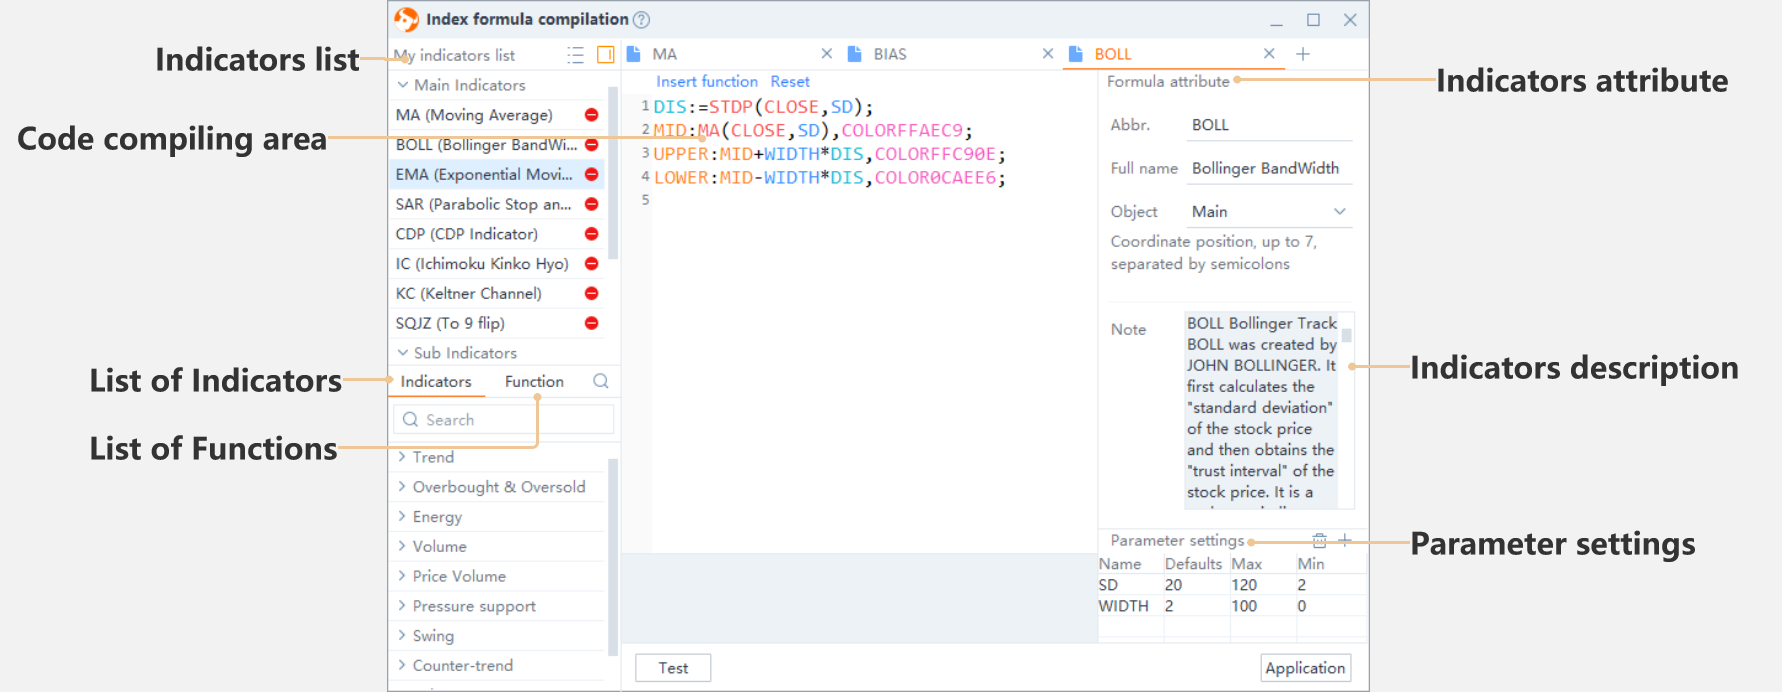
1) Indicators: All the system and customized indicators are presented.
2) Functions: All the system functions are presented.
3) Indicators list: You can add indicators to the "My indicators list" by selecting indicators from the "Indicators" tab. All the indicators are shown on the "Indicators" tab; you can easily add or hide indicators by clicking the "- (hide)" or "+ (add)" button.
4) Code compiling area: you can edit your scripts or compile functions in this area.
5) Formula attribute: The abbreviation, full name, object, and coordinate position of an indicator are presented.
6) Note: Relative descriptions of an indicator are presented.
7) Parameter settings: You can set the parameter name, default value, maximum, and minimum.
To add new indicators, delete indicators, import/export indicators, search indictors/function, and edit indicator script
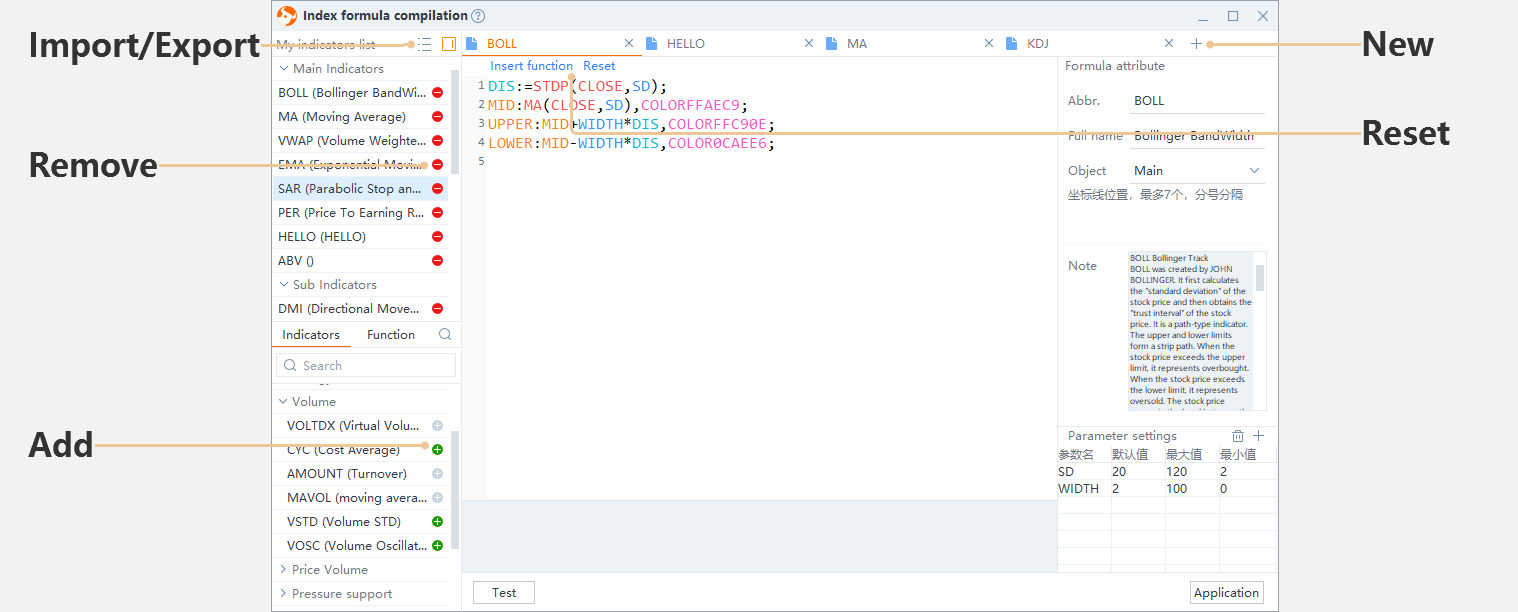
1) Add a new indicator: Click the "+" add button on the top, input scripts, attributes, and parameter settings in the blank compilation page, and then click the "Test" and "Application" buttons to compile your indicator. If the script passes the system's test, your new indicator is added successfully.
2) Add/Remove an indicator: Click the red icon to delete an indicator, and click the green icon to add an indicator.
3) Export indicators: ICON -- Export indicator
4) Import indicators: ICON -- Import indicator
1) Variable: Orange (you can draw line or dot in the k-chart); Light Blue (you cannot draw line or dot in the k-chart)
2) Function: Red (function that is not defined)
3) Parameter: Blue (you need to set values in "parameter settings")
4) Color Function: Purple
5) Constant: Green
Process: New page -- Input indicator information -- Input code -- Test and Application --Use indicator
1) MA (Moving Average) -- Object: Draw lines in main chart.
MA20:MA(C,N1),COLORRED;
MA60:MA(C,N2),COLORBLACK;
MA120:MA(C,N3),COLORYELLOW;
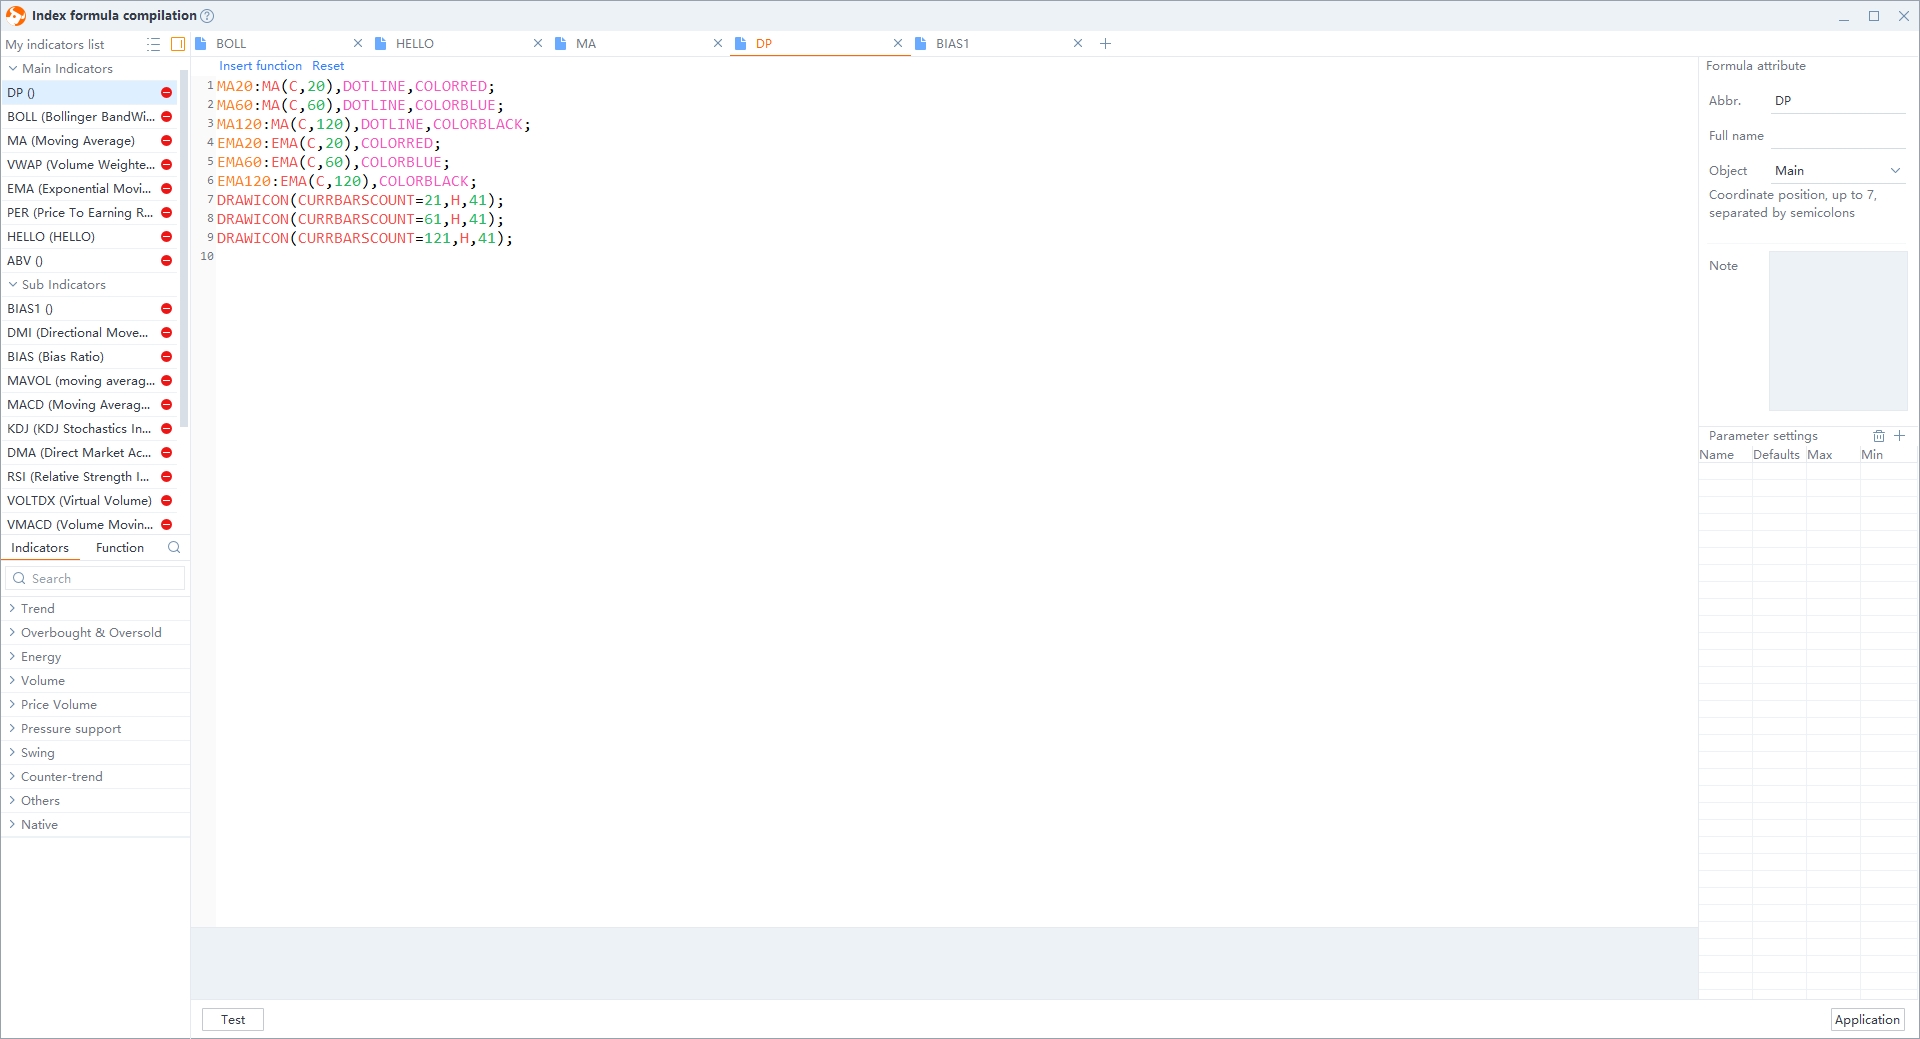
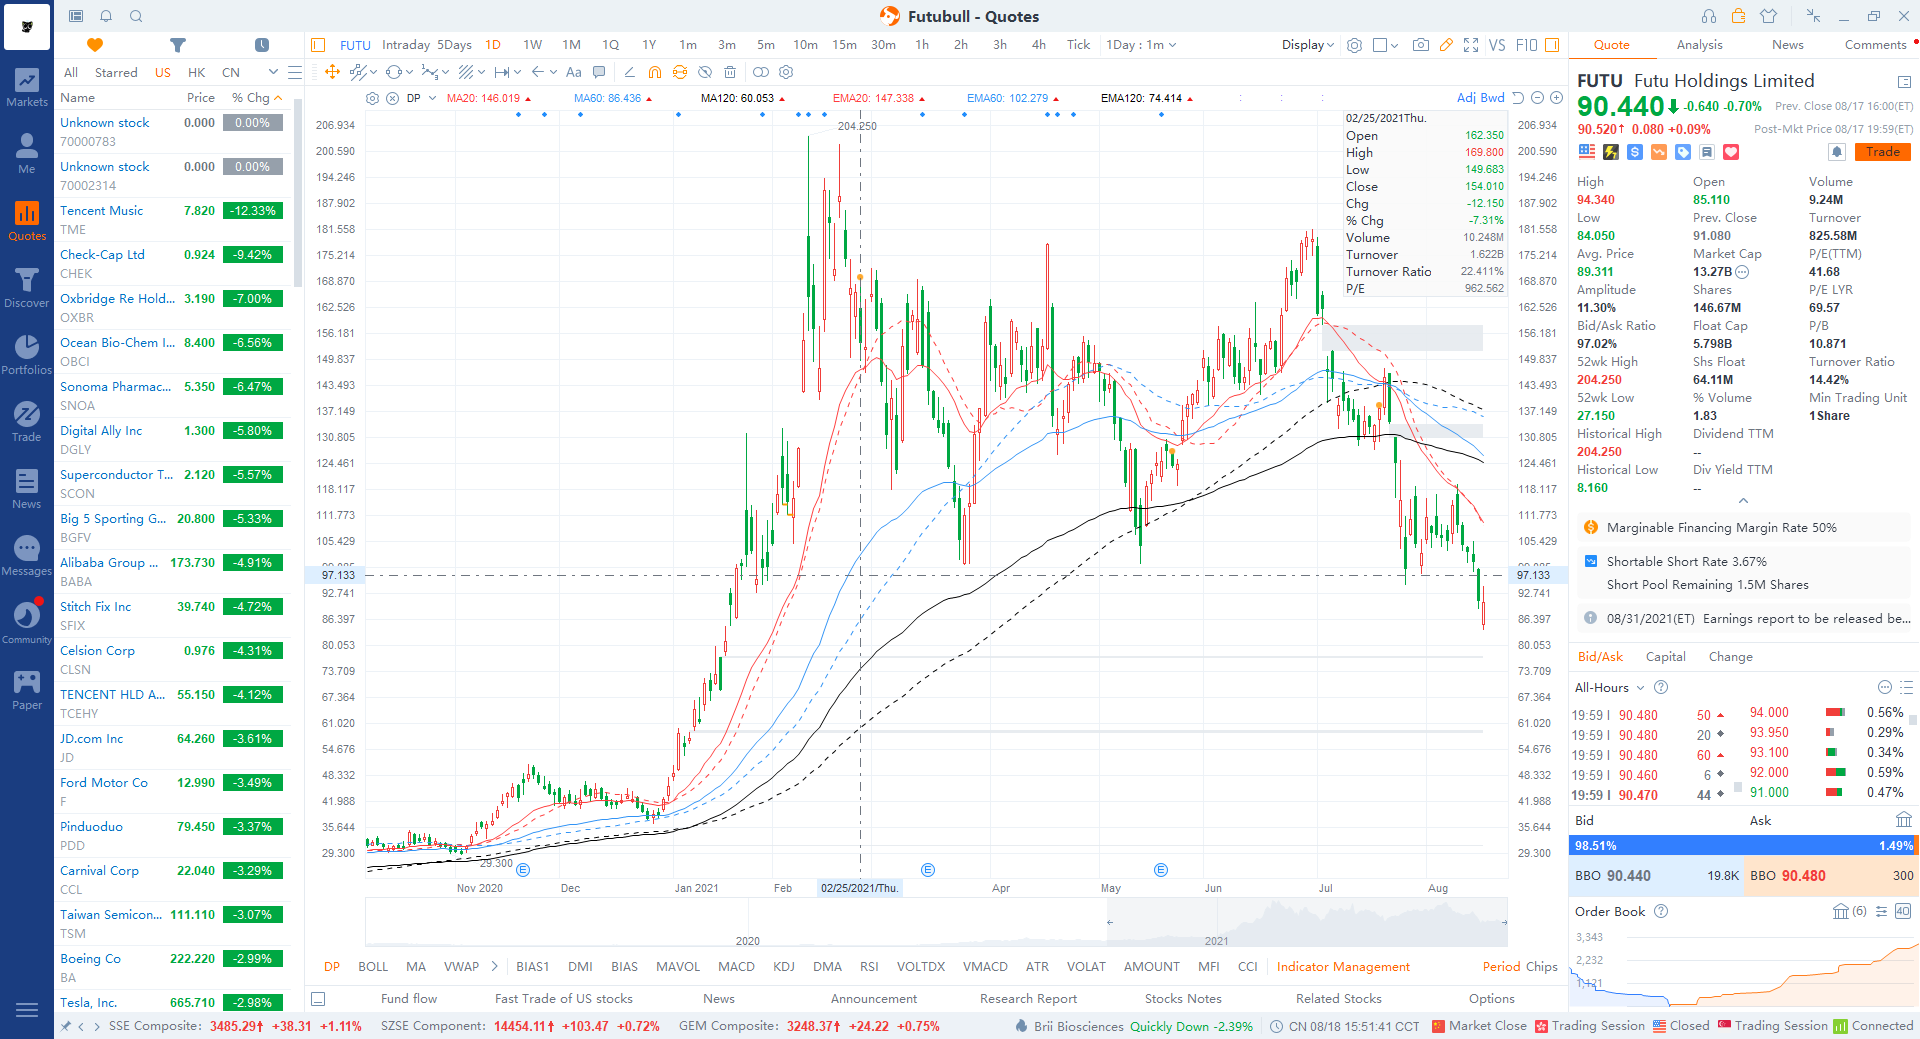
2) Deduction price -- Object: Draw lines and dots in chart.
MA20:MA(C,20),DOTLINE,COLORRED;
MA60:MA(C,60),DOTLINE,COLORBLUE;
MA120:MA(C,120),DOTLINE,COLORBLACK;
EMA20:EMA(C,20),COLORRED;
EMA60:EMA(C,60),COLORBLUE;
EMA120:EMA(C,120),COLORBLACK;
DRAWICON(CURRBARSCOUNT=21,H,41);
DRAWICON(CURRBARSCOUNT=61,H,41);
DRAWICON(CURRBARSCOUNT=121,H,41);
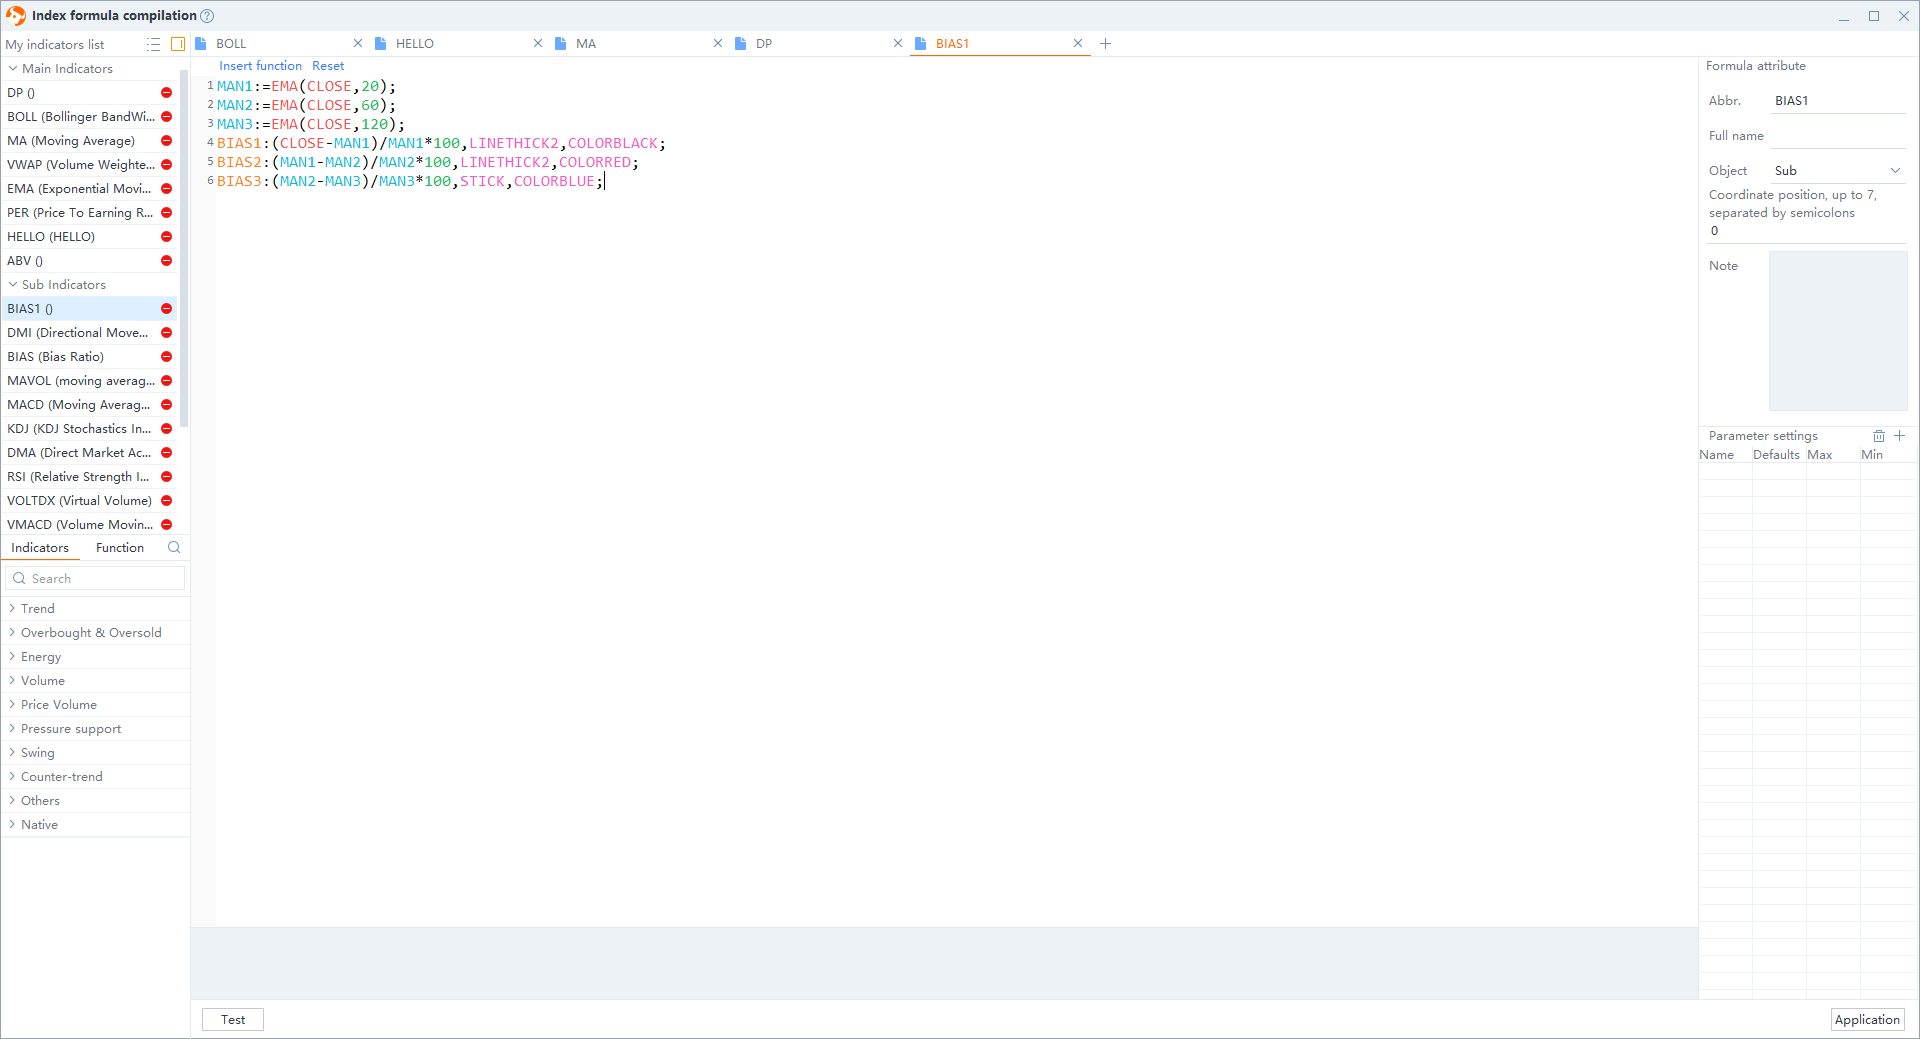
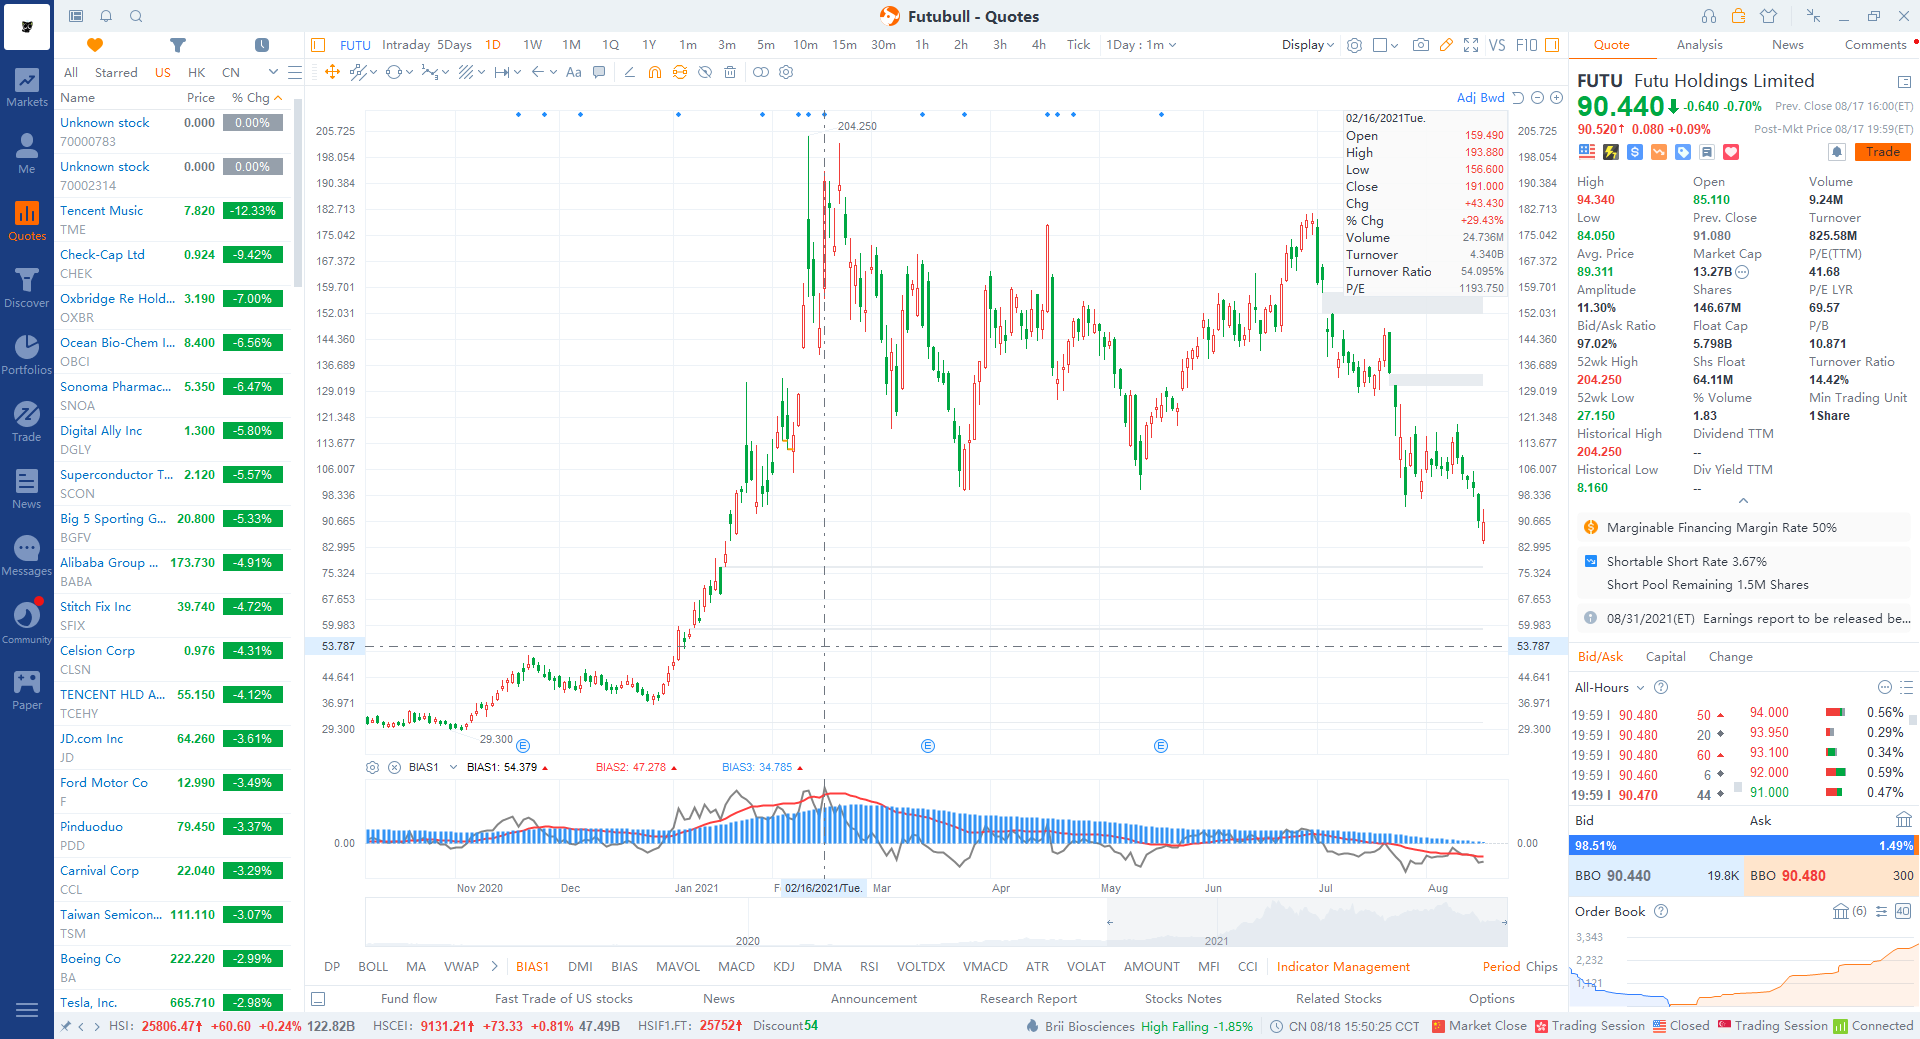
3) BIAS (Bias Ratio) -- Object: Draw lines, histogram, and coordinate line in sub chart.
MAN1:=EMA(CLOSE,20);
MAN2:=EMA(CLOSE,60);
MAN3:=EMA(CLOSE,120);
BIAS1:(CLOSE-MAN1)/MAN1*100,LINETHICK2,COLORBLACK;
BIAS2:(MAN1-MAN2)/MAN2*100,LINETHICK2,COLORRED;
BIAS3:(MAN2-MAN3)/MAN3*100,STICK,COLORBLUE;
Write down your annotation within curly brackets "{ }".
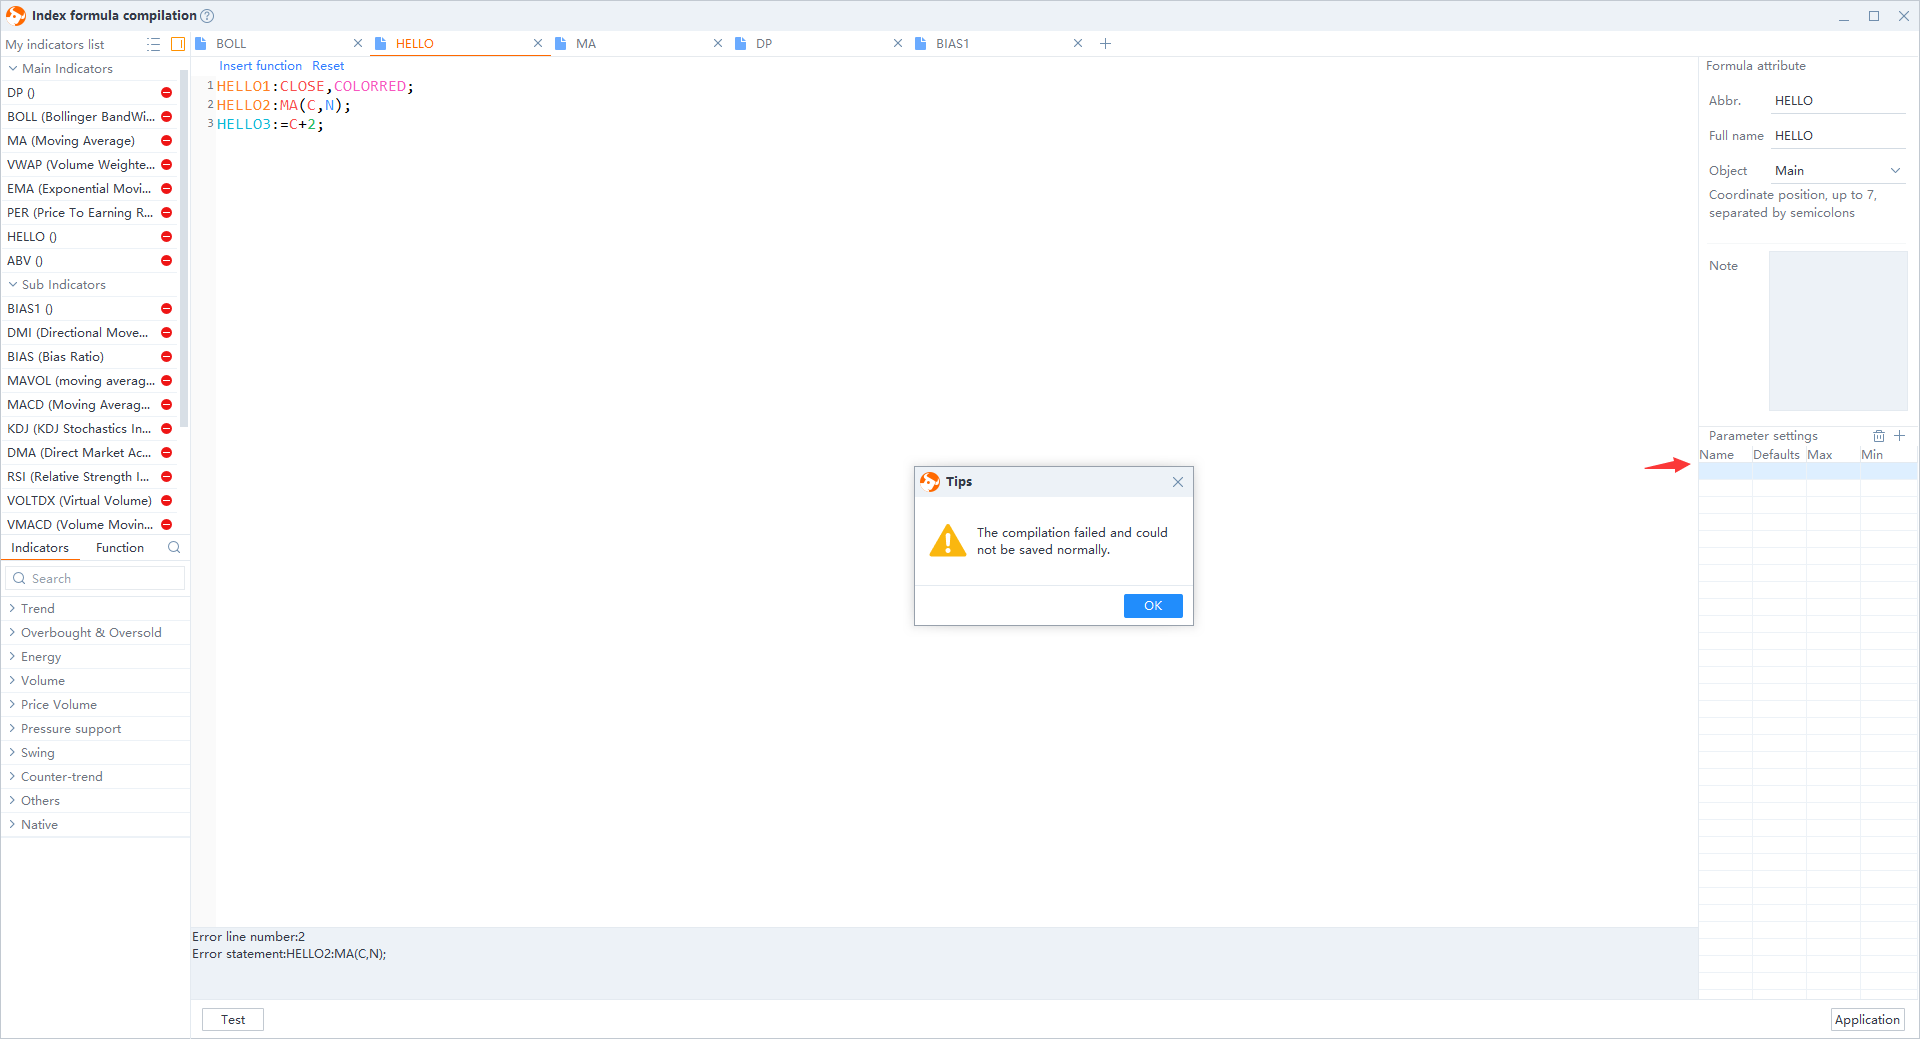
1) No parameters
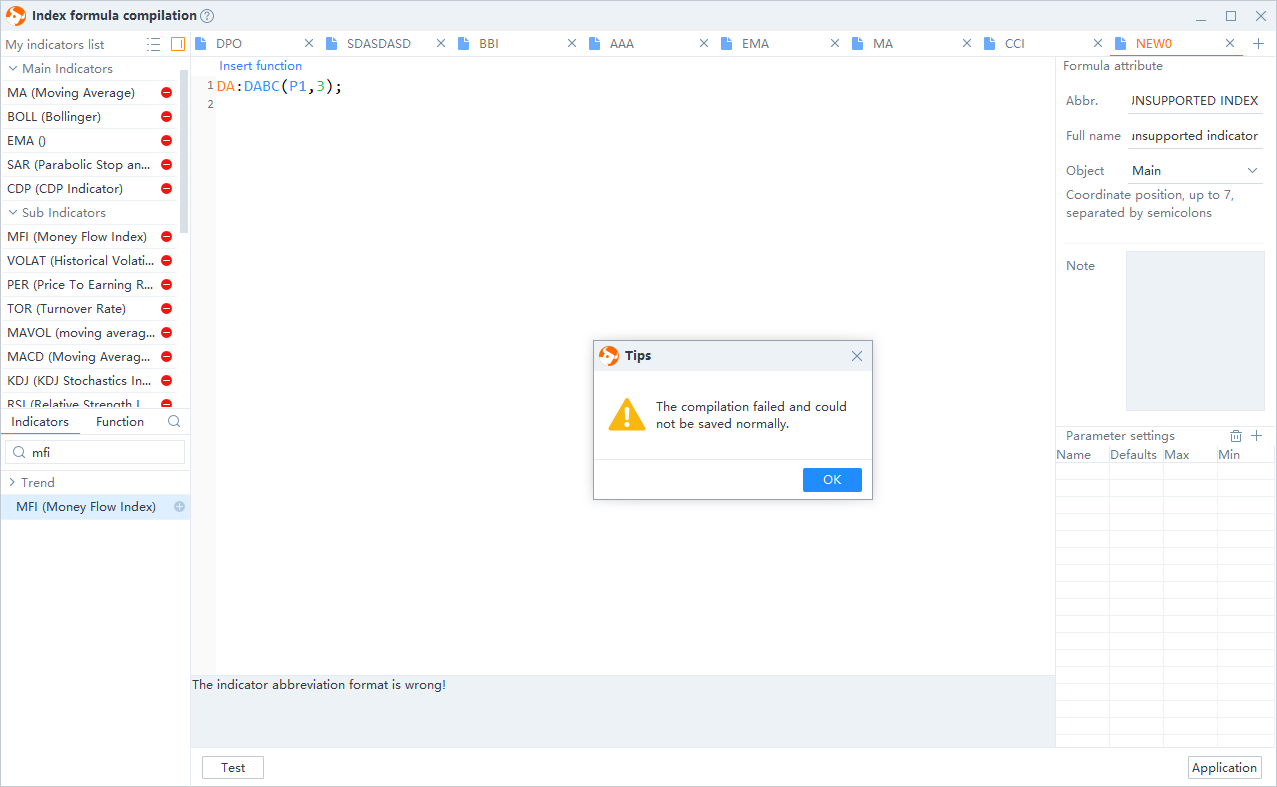
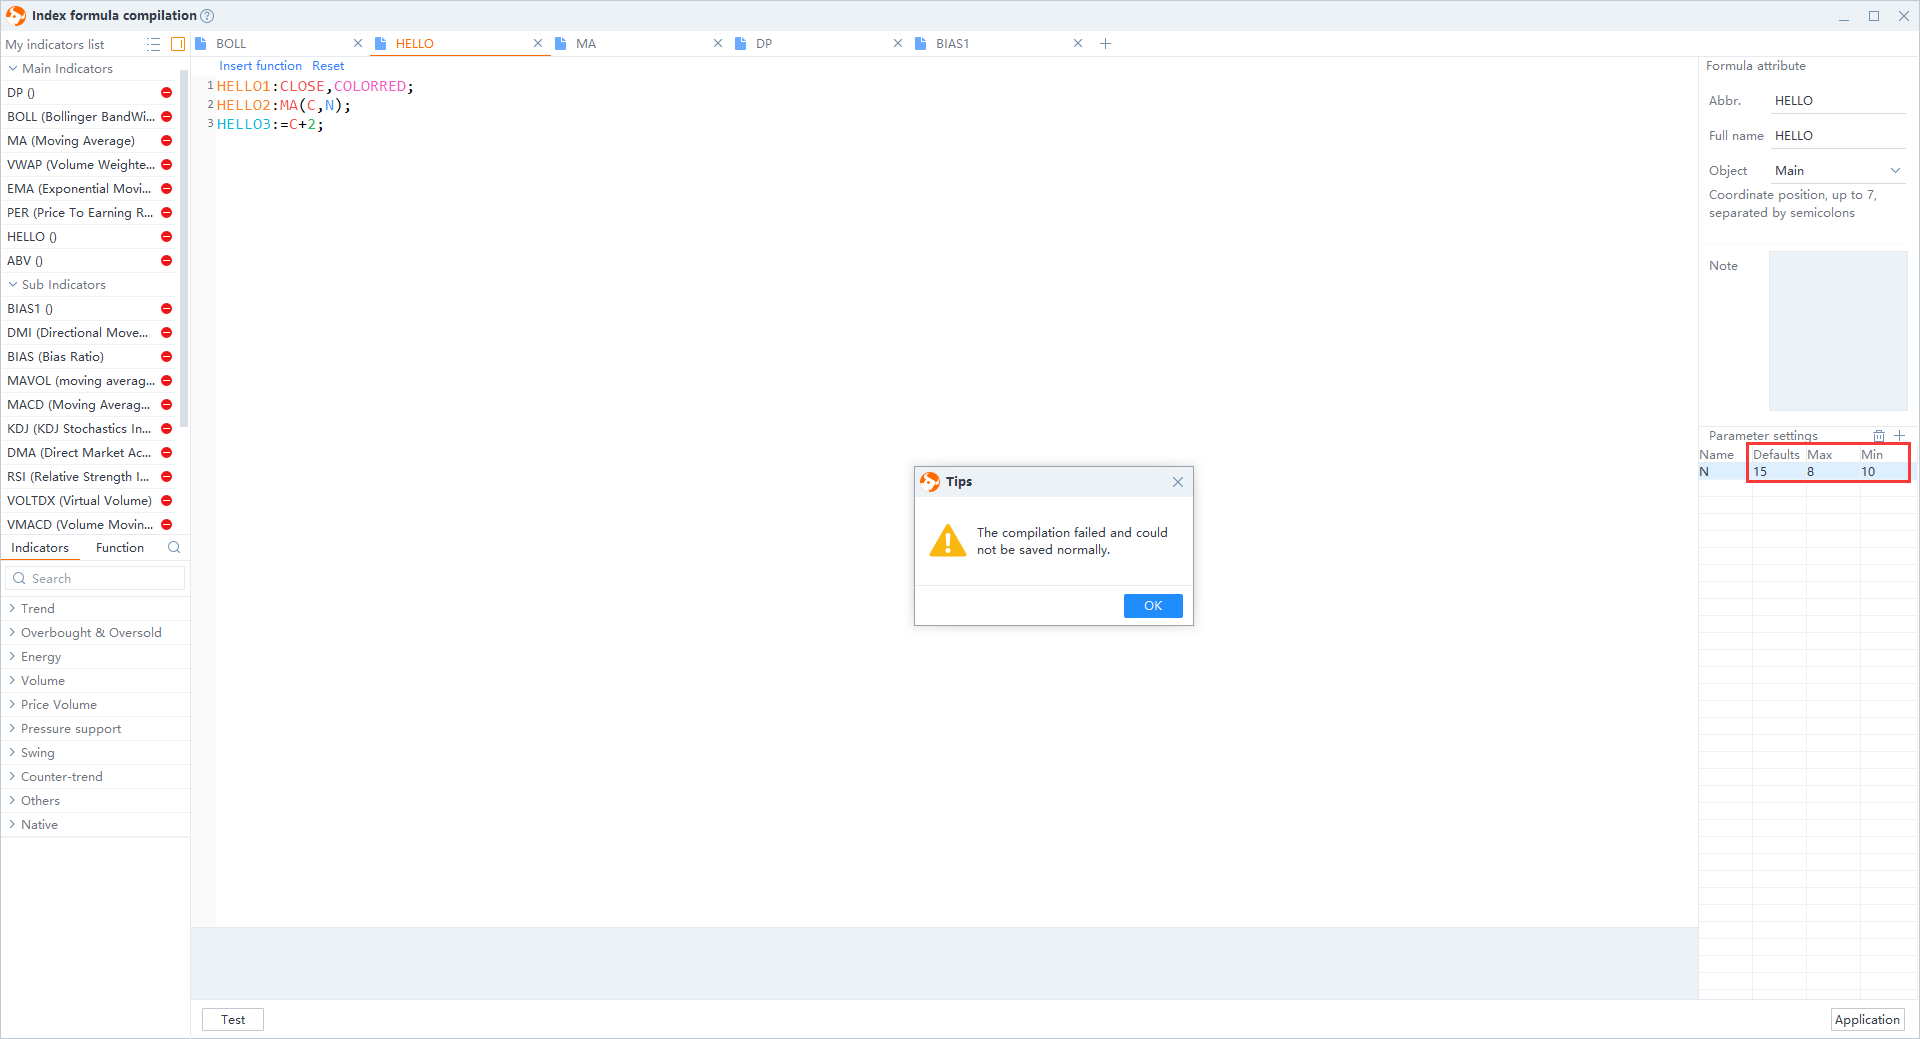
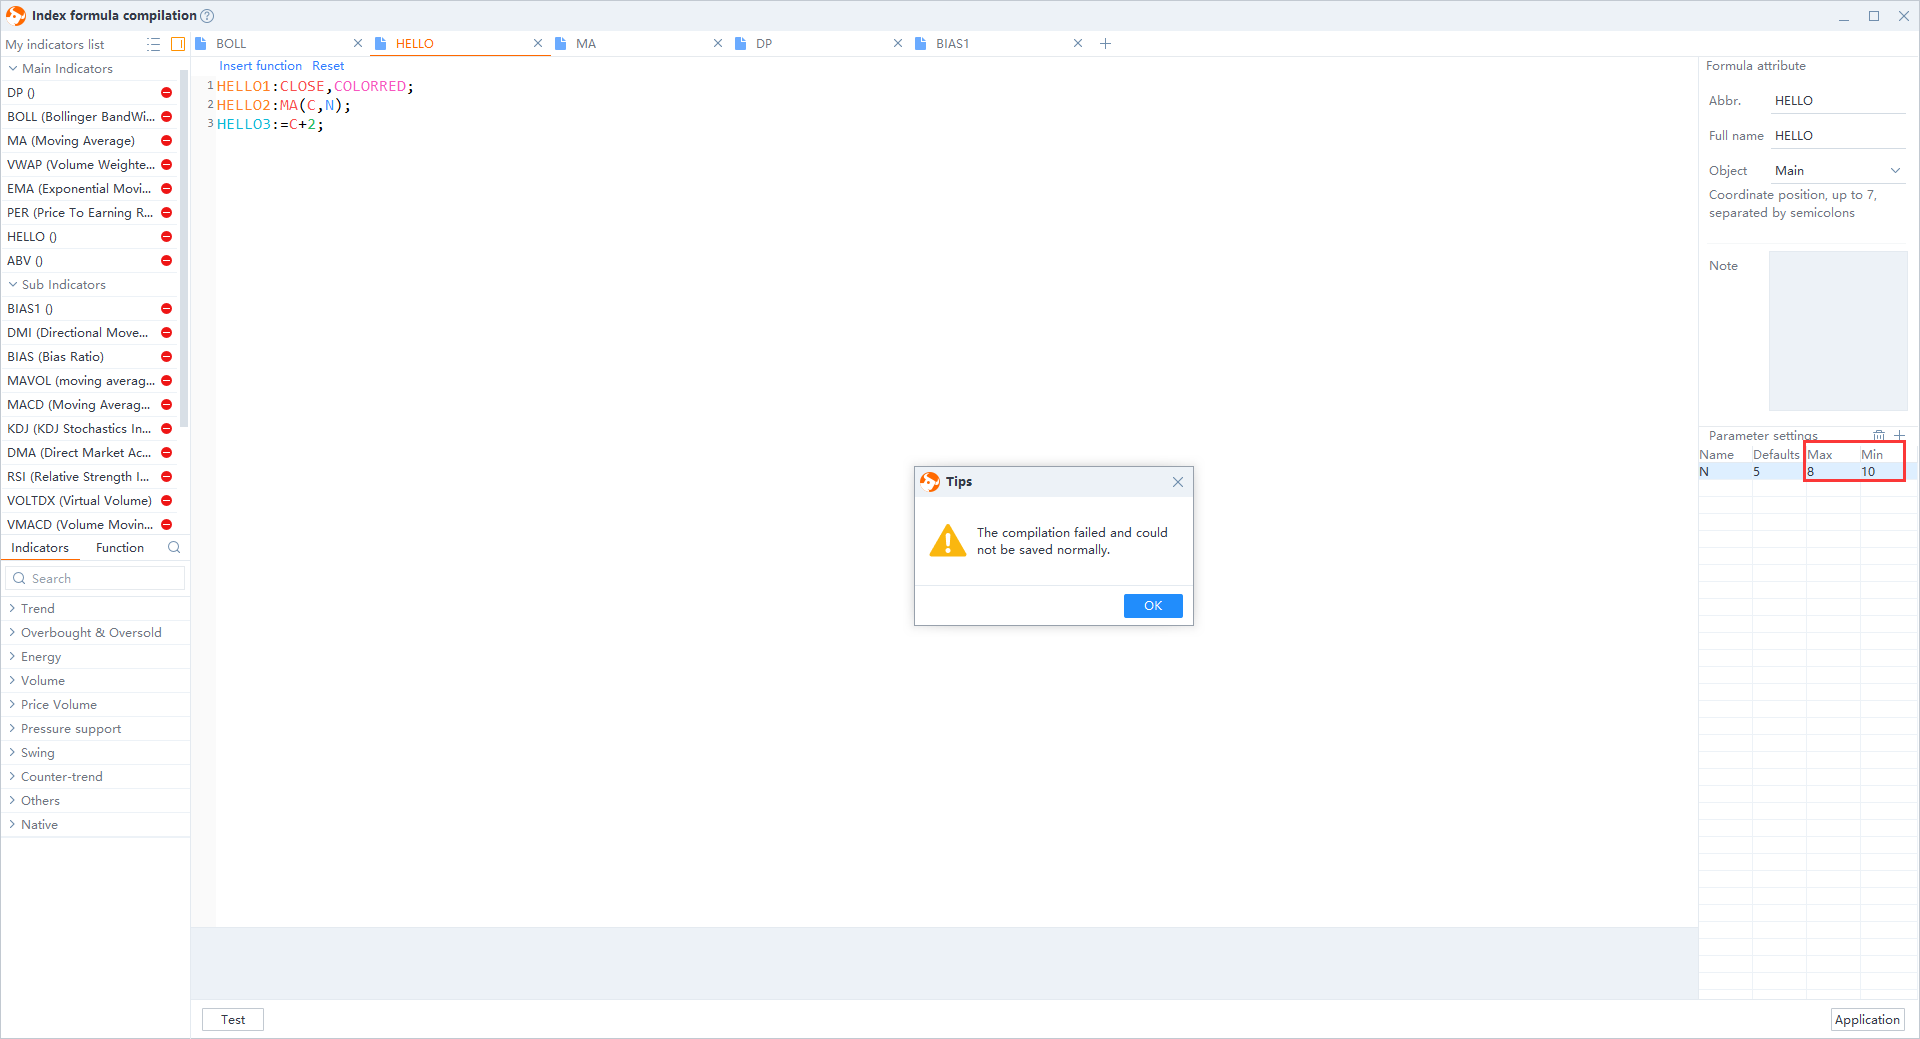
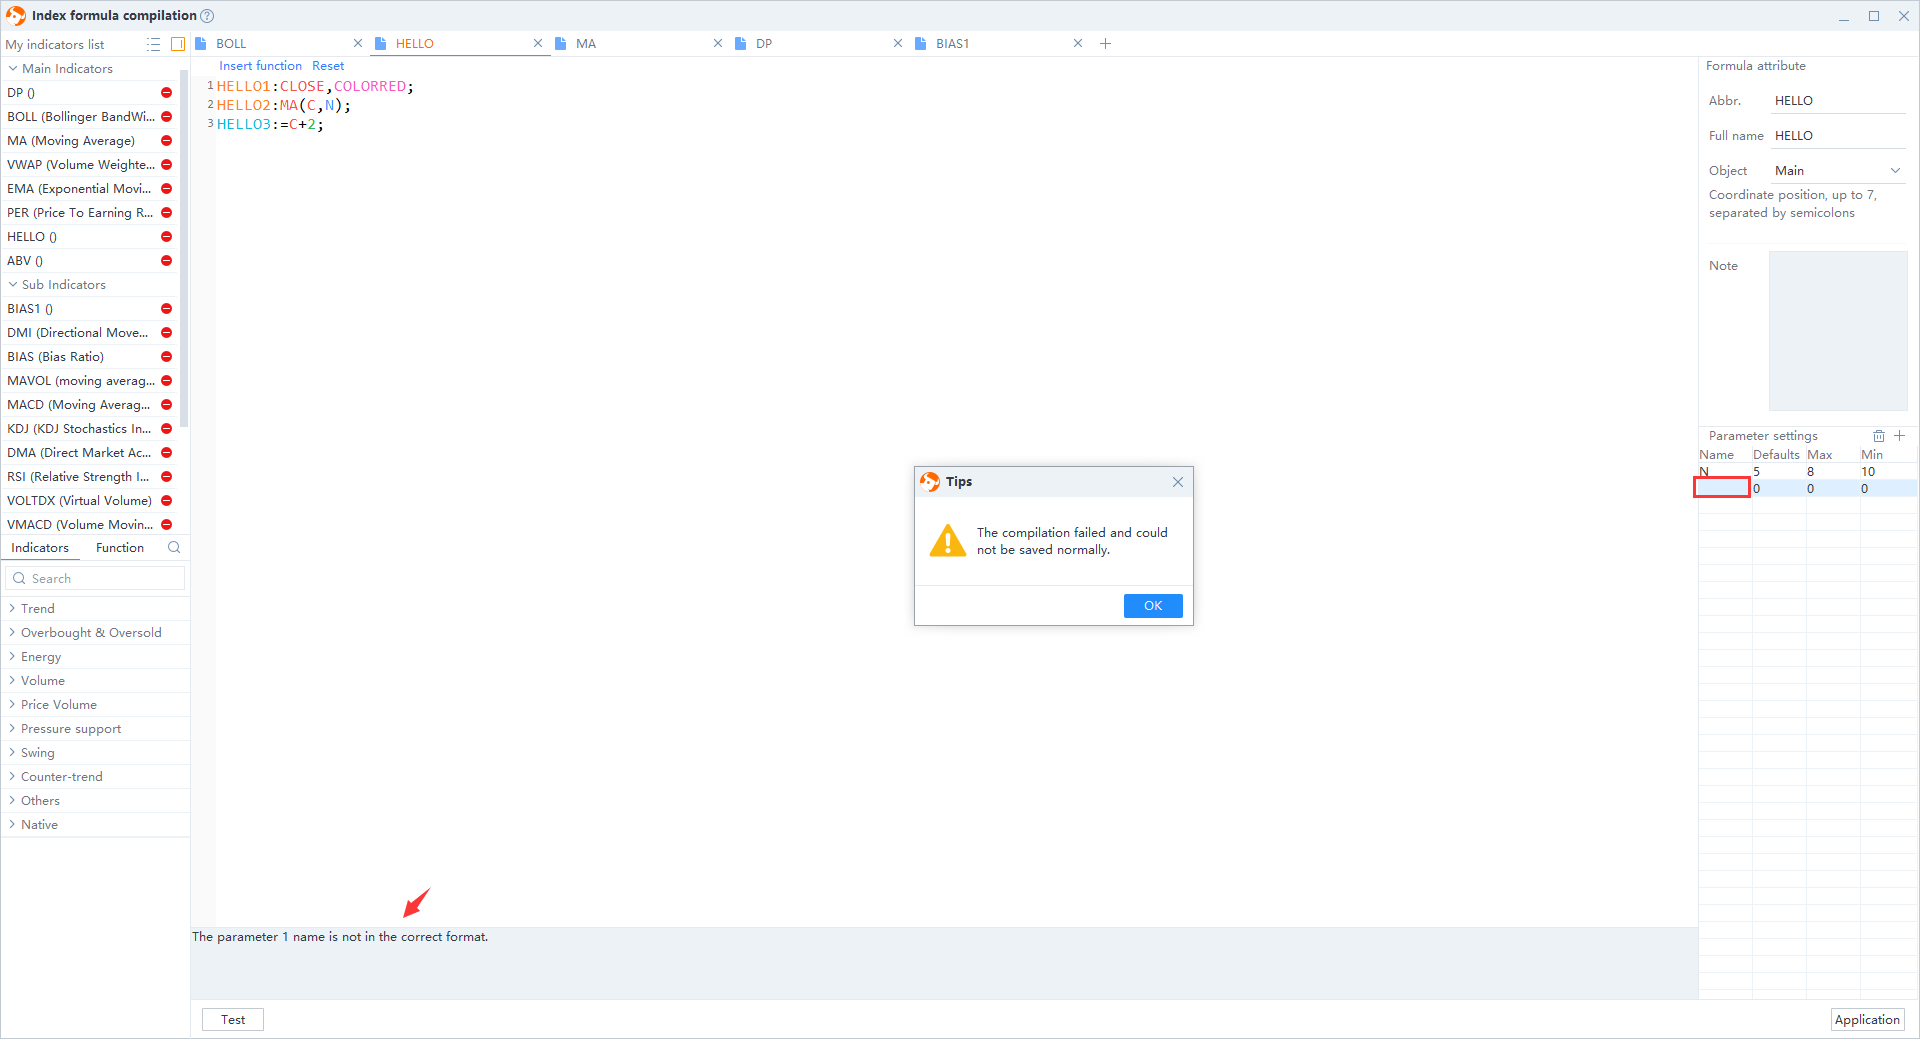
2) Abnormal parameter
a) senario 1: The default value is not between the maximum and minimum.
b) senario 2: The maximum is smaller than the minimum.
c) senario 3: no parameter name
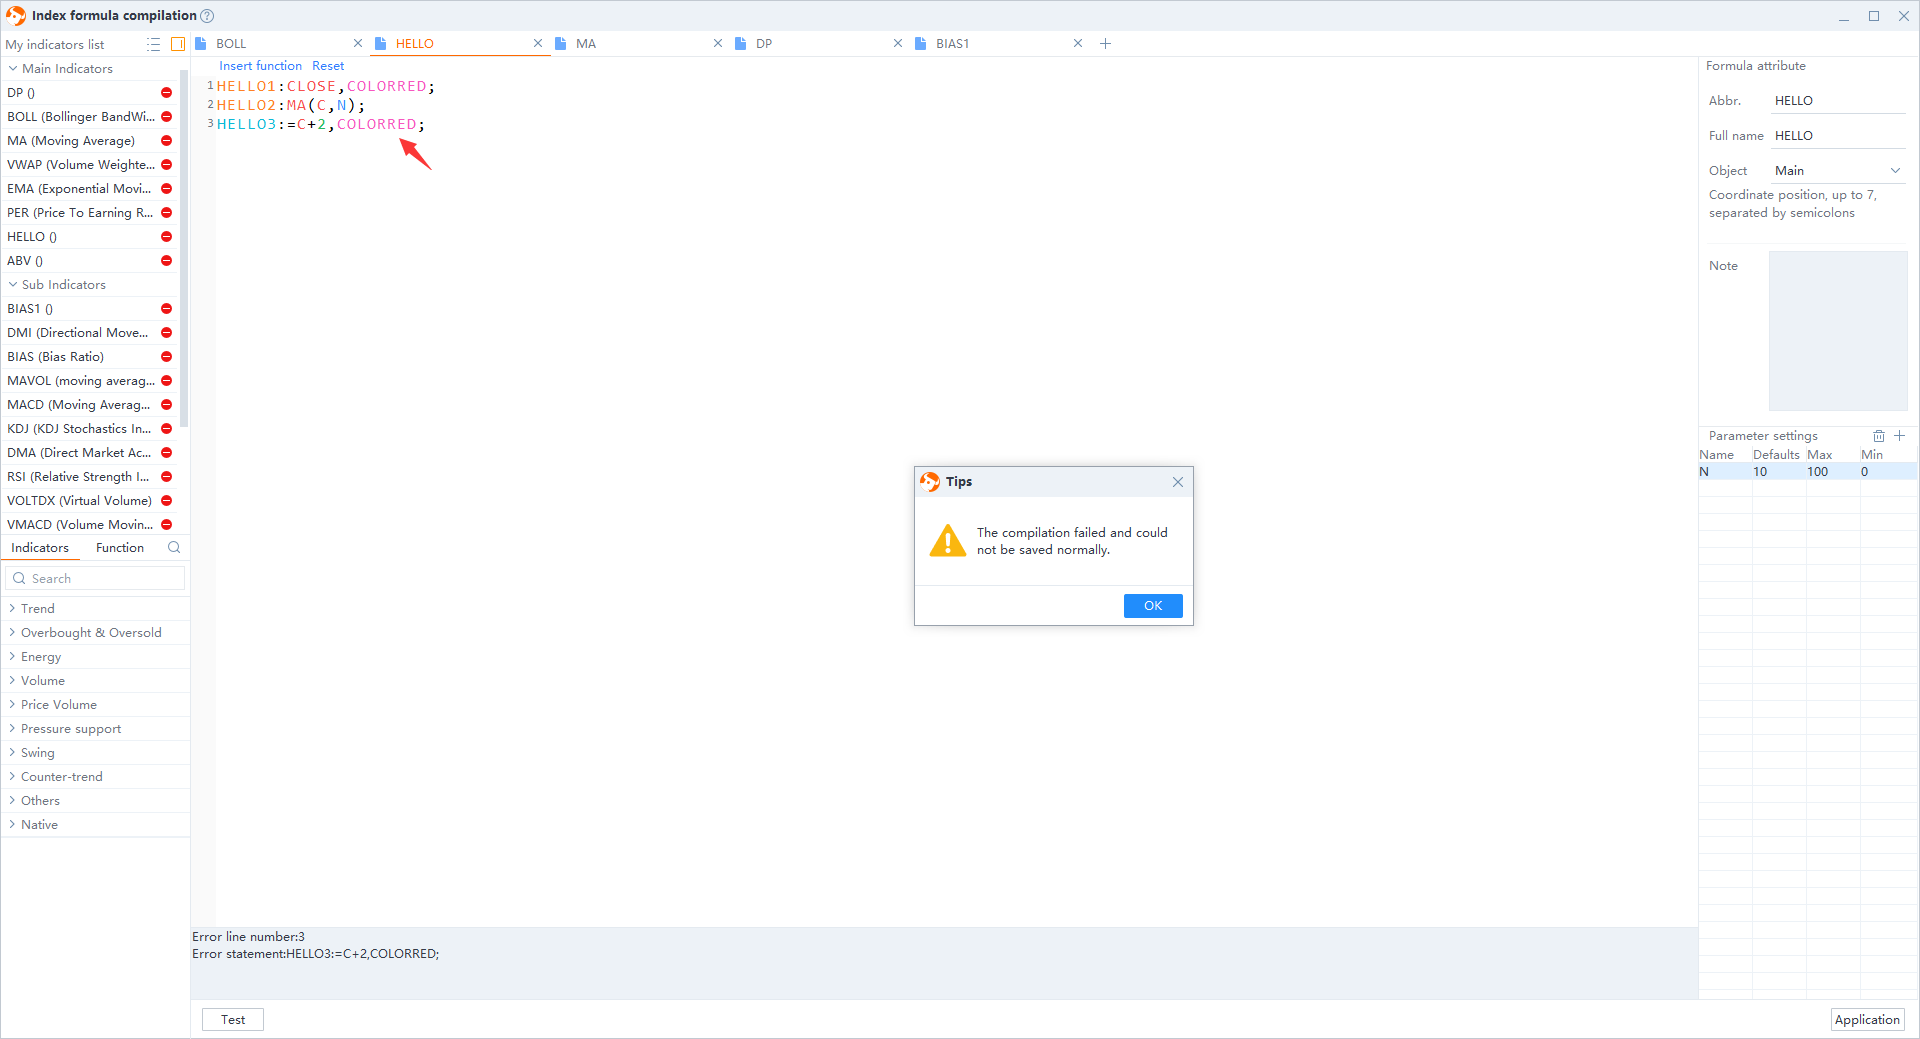
3) Drawing line function is added to an undrawable line indicator formula
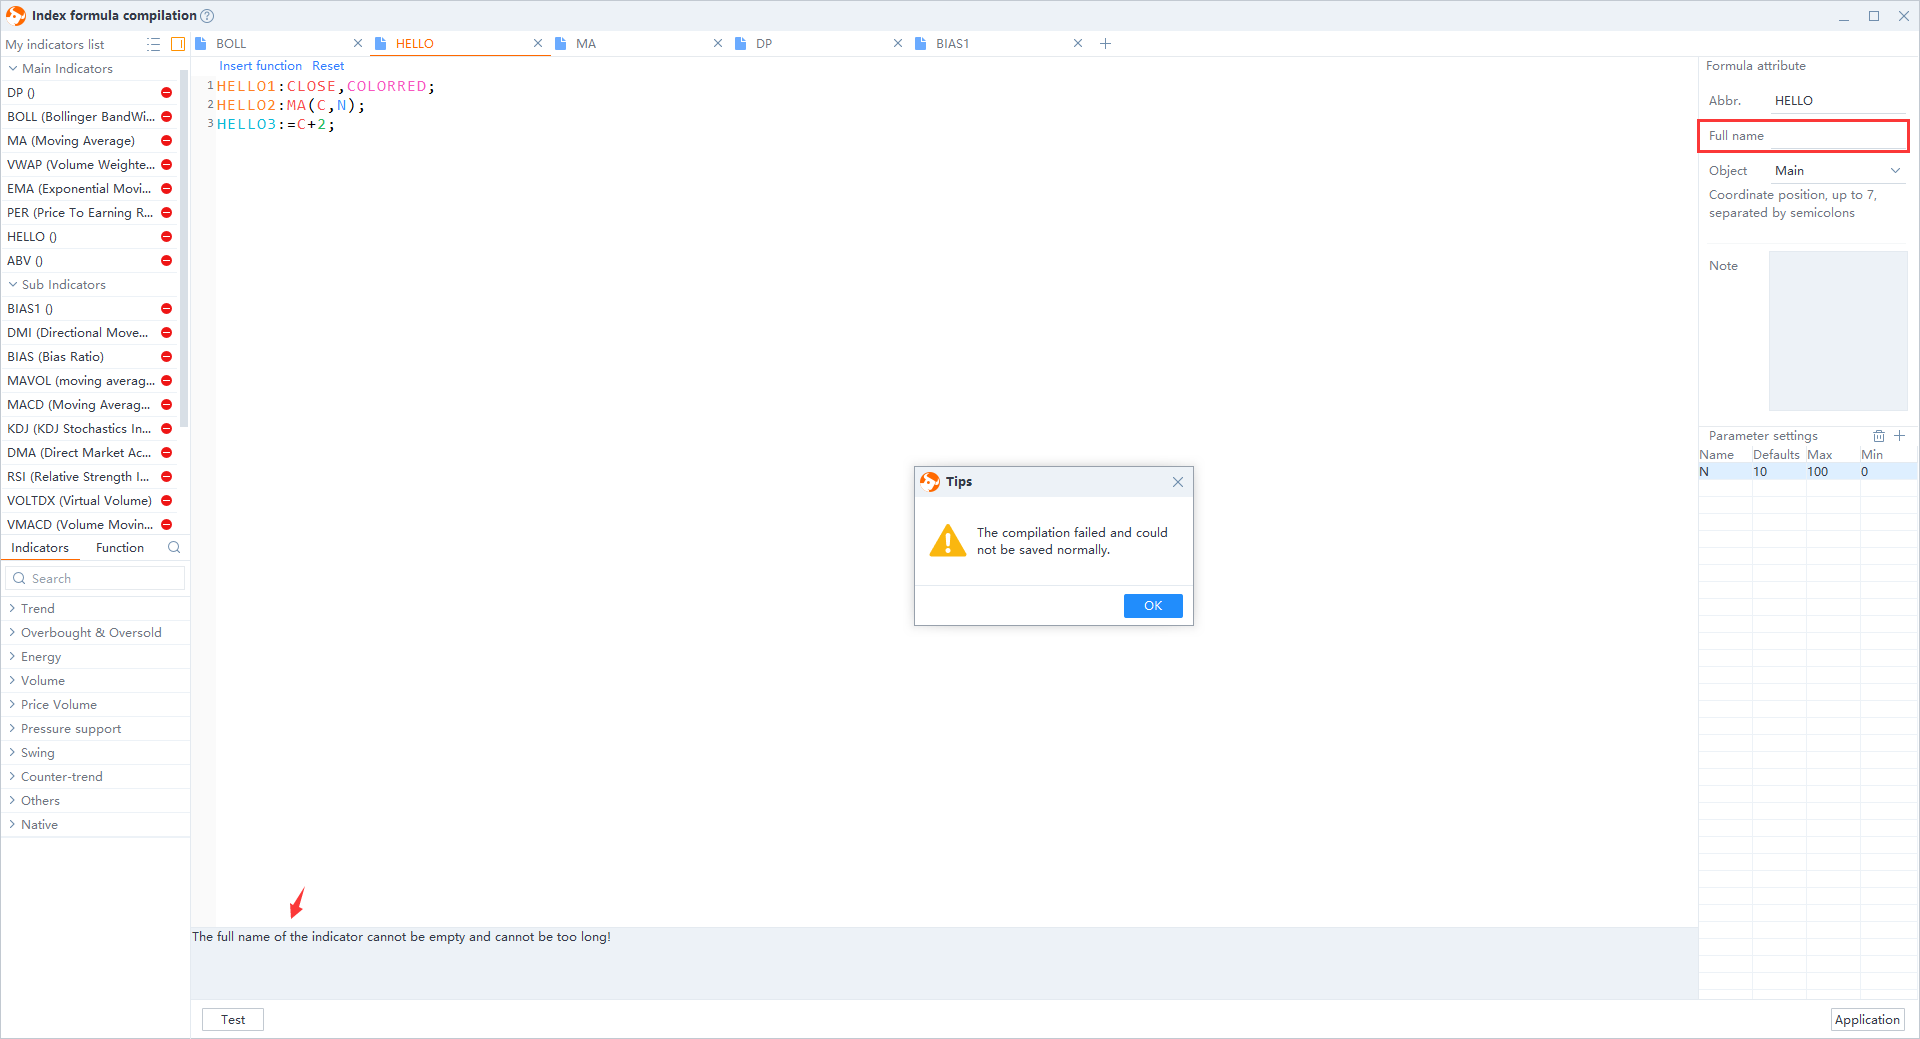
4) Empty full name of the indicator
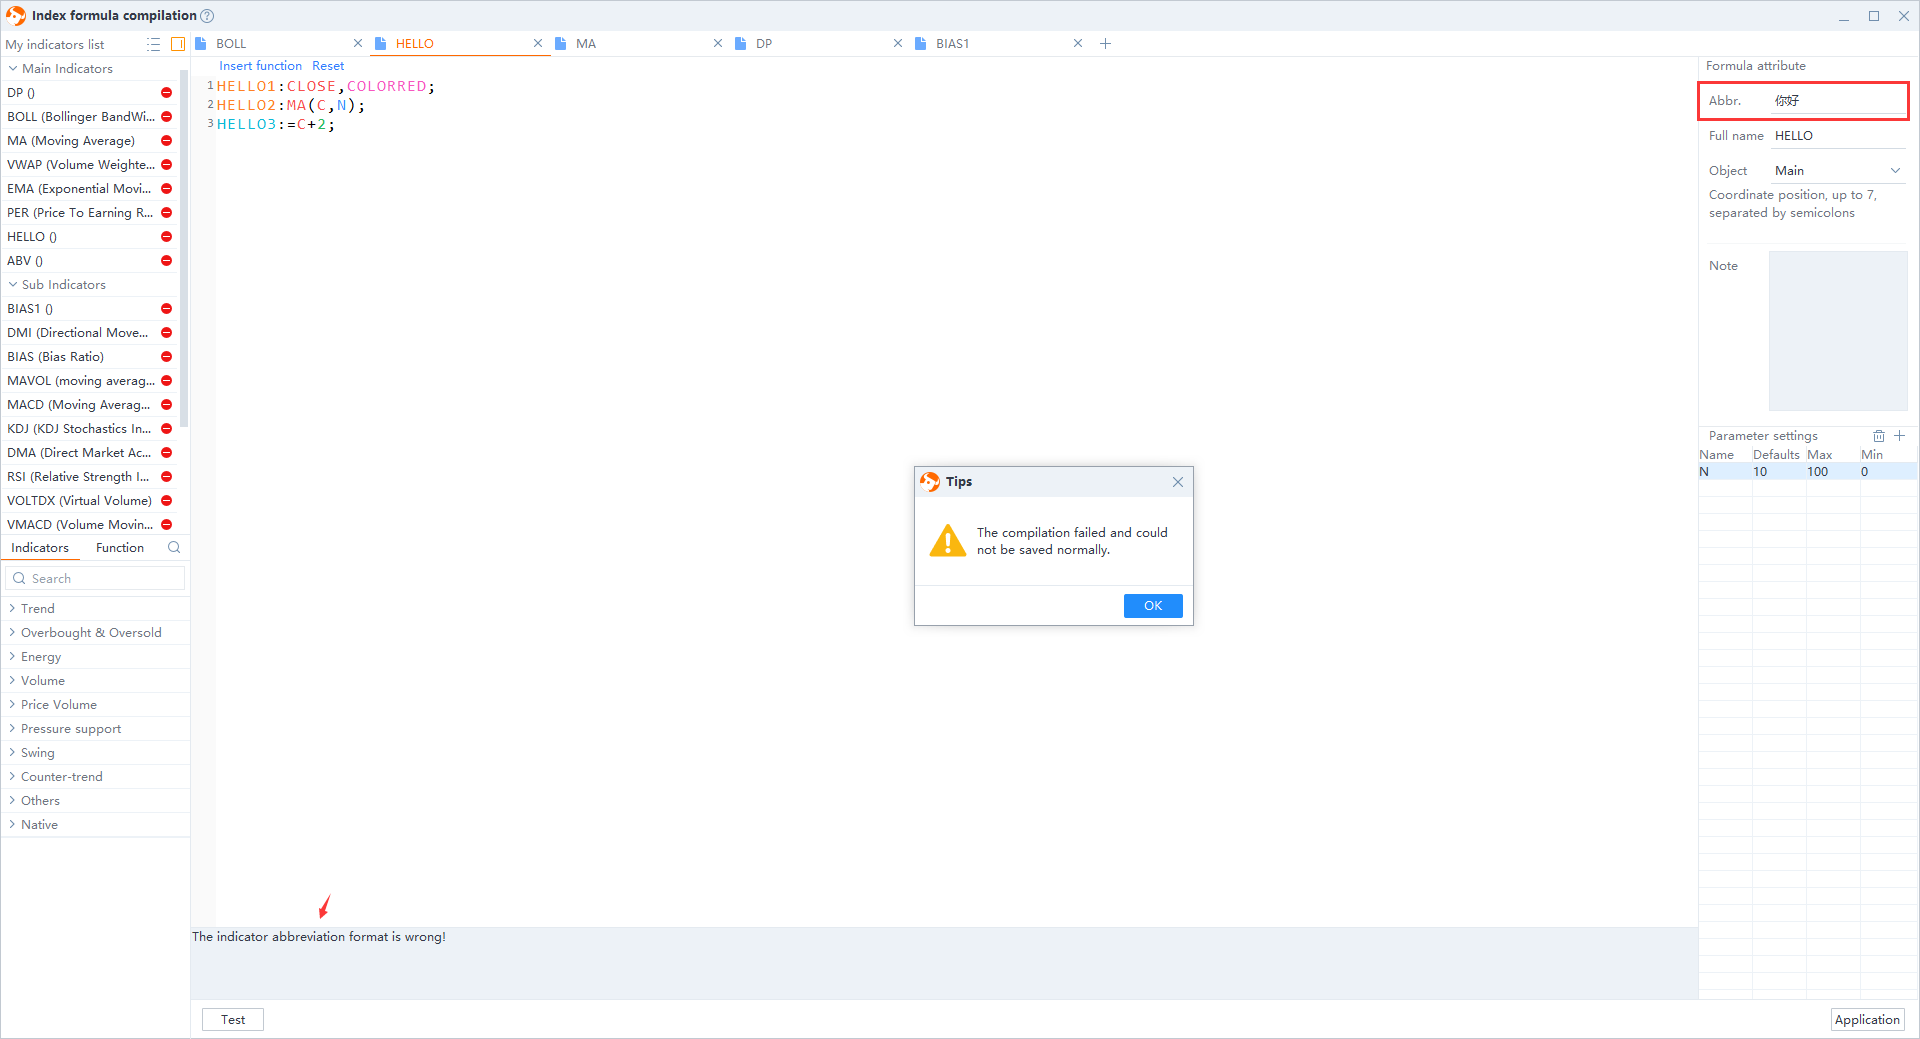
5) Abbreviation error (English only)
6) Functions that are currently not available
At present, there are many types of indicators used by technical investors. Some functions such as Tower, Anchored VWAP, Force index, and TTM squeeze are not yet available. We are now conducting a preliminary research on the function algorithm. If you need to add new functions, you can contact us through the customer service email or telephone.