
MEITUAN-W
03690
XIAOMI-W
01810
JD-SW
09618
4
POP MART
09992
5
BABA-W
09988


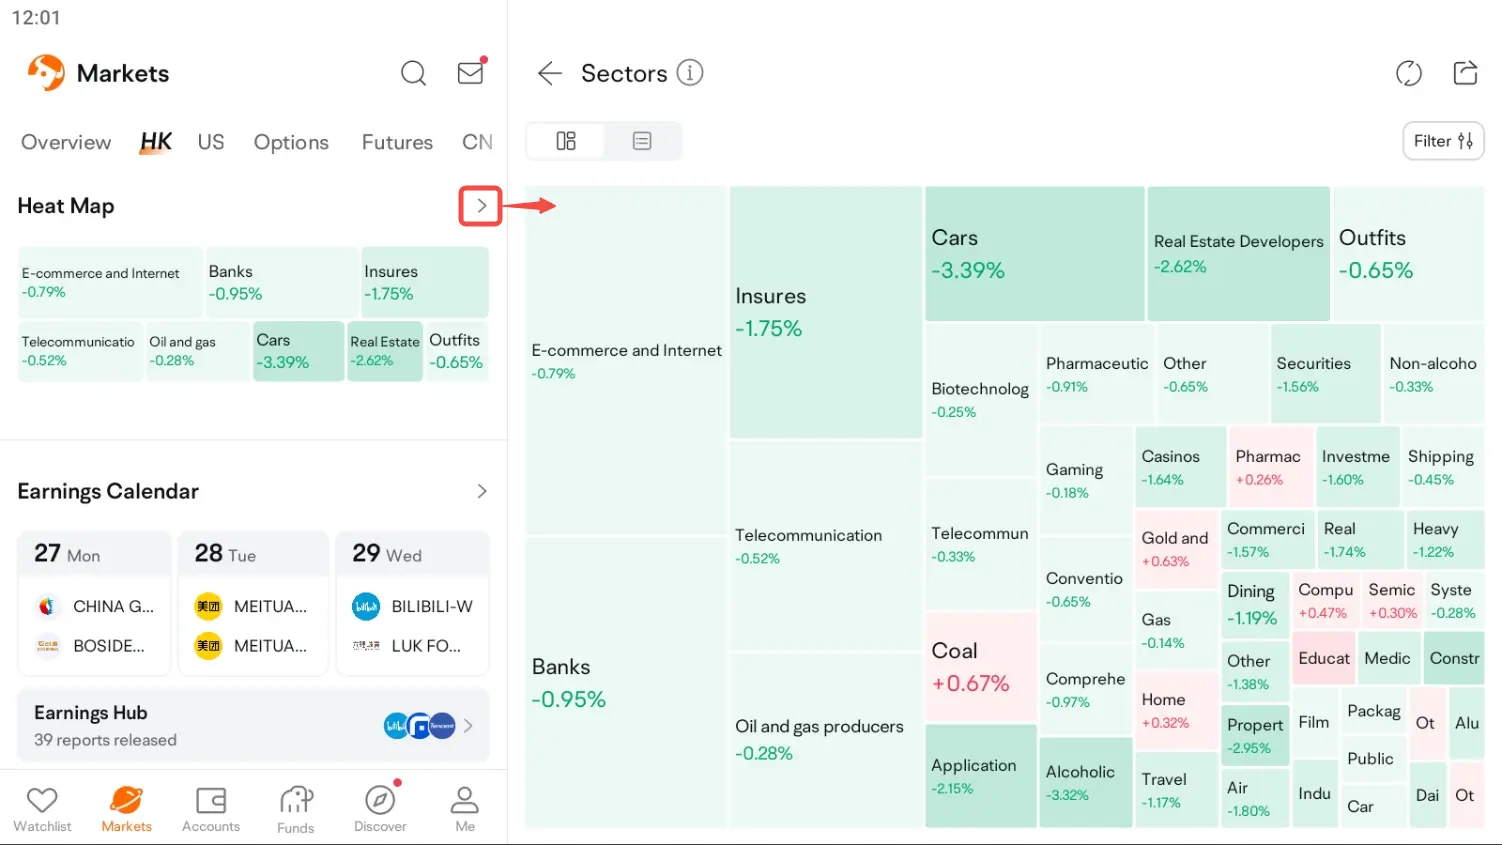
The heat map can be drawn by Market Cap, Volume, and Turnover. Take the heat map drawn by Market Cap as an example. The larger the total market value of the corresponding stock is, the larger the sector area will be. The sector area is calculated as follows:
Sector Area = Total Area * Sector Market Cap / Total Market Cap
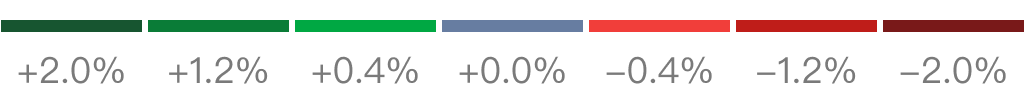
Square color reflects gains and losses of a sector. The stronger the price moves, the greater the contrast between square color and background color.
Green Up / Red Down:
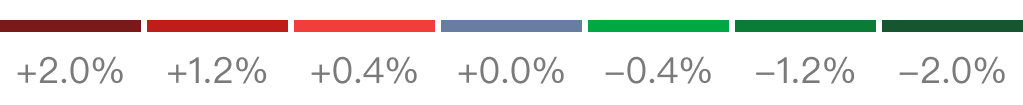
Red Up / Green Down:
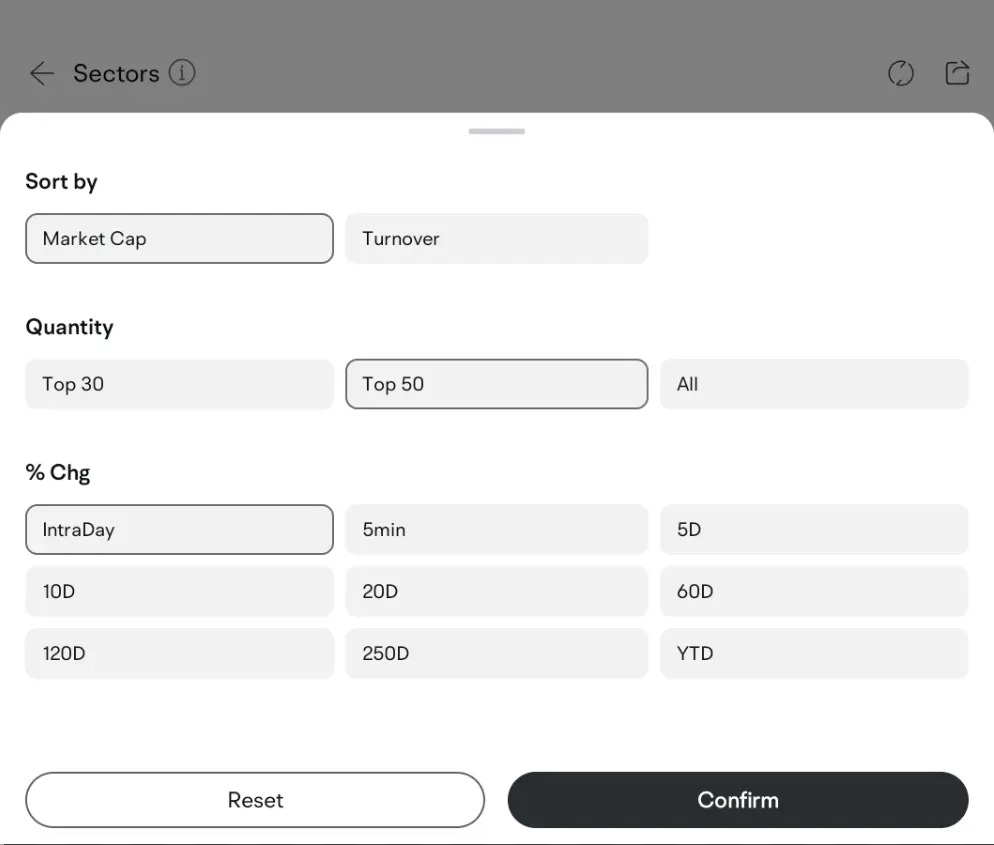
Sorting will affect the order and area of a sector. You can sort the sectors by Market Cap, Volume, and Turnover.
The quantity of sectors will be changed. Top 30, Top 50, and All are available.
%Chg will affect the color of a sector. You can view it by intraday, 5m, 5D, 10D, 20D, 60D, 120D, 250D, and Year.

 This strategy is often seen in tariff policies and trade negotiations.
 First, he scared everyone quite a bit, and then he gave a little reward.Imagine you are bargaining in a vegetable market, and Trump's approach is to first raise a loudspeaker and shout: "This pile of cabbage must be sold to me for 100 yuan today!" When the vendor is stunned, he suddenly rubs his hands and says: "But seeing that you are not having an easy time, let's settle for 80 yuan~"

