1. Function entrance
1.1 App
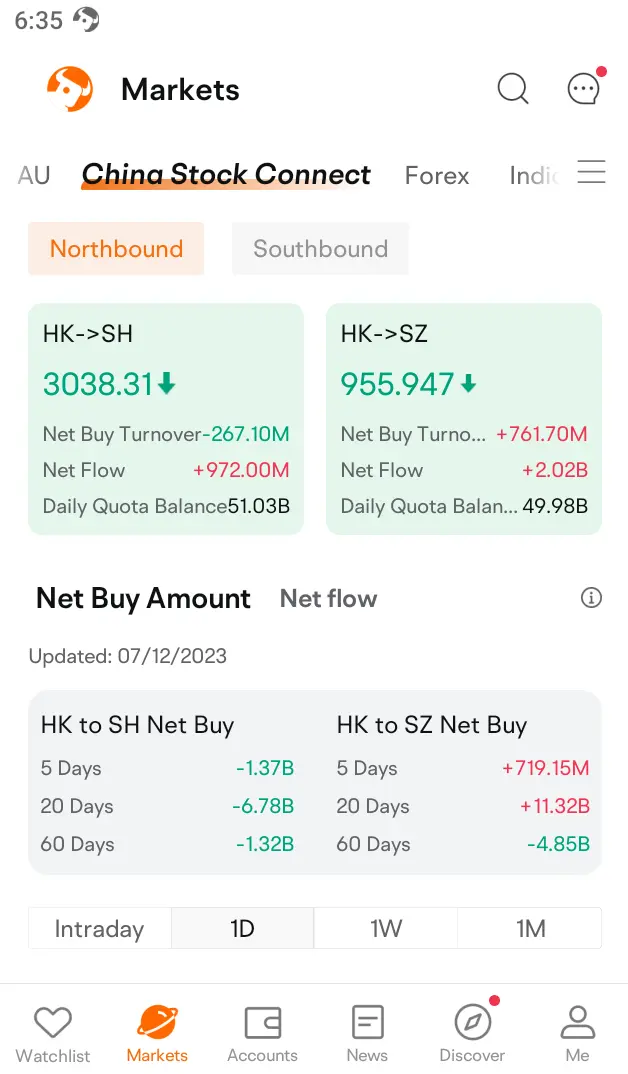
By clicking "Markets-Stock Connect", you can enter the detail page:
Click on a single section on the "China Stock Connect" page, or search for the section name code to enter the section detail page.

1.2 Desktop
Click "Markets-Stock Connect" to view all data
2. Function introduction
2.1 Capital Flow Trend

2.1.1 This module displays the flow of funds in the four cyclical dimensions of HK->SH Connect, HK->SZ Connect, SH->HK Connect and SZ->HK Connect, as well as the index closing price curve related to the sector.
2.1.2 Chart that can be switched between different periodic dimensions, a total of four periodic dimensions: today, Historical Daily, Historical Weekly, Historical Monthly
2.1.3 (desktop support only) can hide the trend chart of the corresponding plate or index
2.1.4 long press the chart area to view the specific data of a single point; drag the chart left or right to view historical data.
2.2 Today's quota
This module displays data on the net flow of funds, total amount, and used percentage of HK->SH Connect, HK->SZ Connect, SH->HK Connect and SZ->HK Connect.
2.3 Cumulative net flow of funds
This module displays the accumulated net capital flow of each sector for a period of time. The time is calculated on the basis of trading days, that is, "last 5 days" means the last 5 trading days.
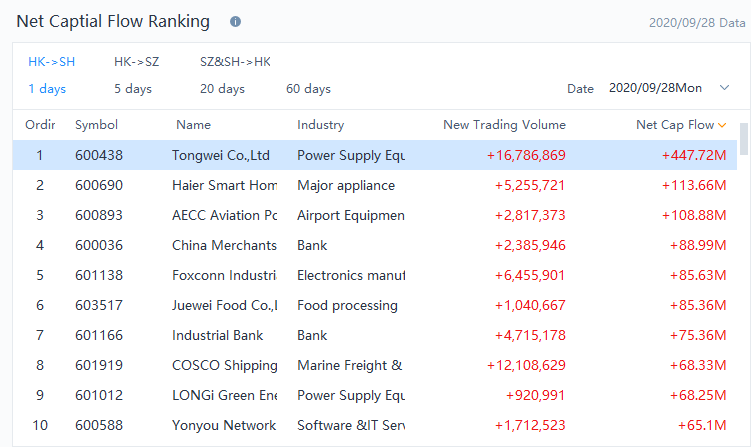
2.4 Net Capital Flow Ranking


This module displays the net number of shares purchased and sold through the north-south channel and the amount of capital flow of each sector's constituent stocks.
Special circumstances:
1) As the constituent stocks of Southbound Trading do not distinguish between the flow of funds in the Shanghai and Shenzhen markets, the Southbound Trading only has one point of the list of capital flows in North Water.
2) Data update time:
i. Due to the T+2 day settlement rule of the Hong Kong Stock Exchange, only the transaction data of the first two trading days on the day of Southbound Trading;
ii. Due to the T+1-day settlement rules of the Shanghai Stock Exchange and the Shenzhen Stock Exchange, the Shanghai Stock Connect and Shenzhen Stock Connect only have transaction data on the previous trading day.
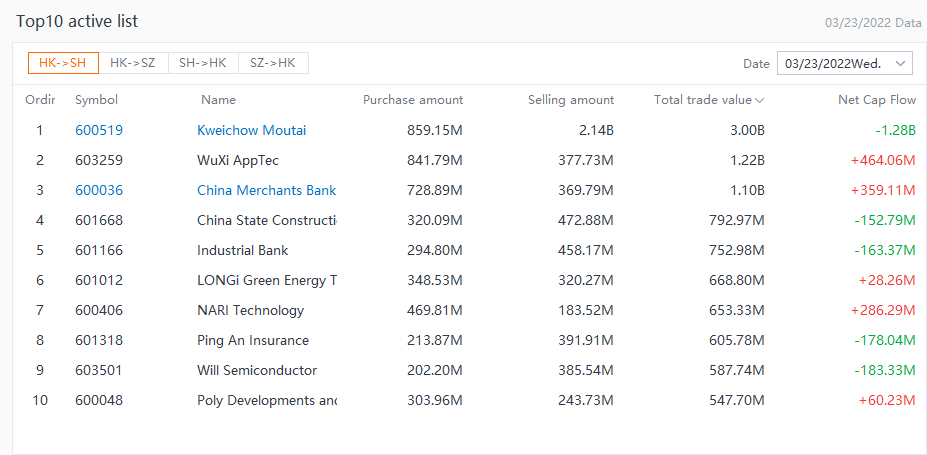
2.5 Actively Trading List


This module displays the ten most active stocks in North and South Water trading on the designated trading day of each sector;
Due to exchange disclosure restrictions, the latest data is only for the T-1 day.


